EBK OPERATIONS MANAGEMENT
14th Edition
ISBN: 9781260718447
Author: Stevenson
Publisher: MCG COURSE
expand_more
expand_more
format_list_bulleted
Videos
Textbook Question
Chapter 3, Problem 18P
New car sales for a dealer in Cook County, Illinois, for the past year are shown in the following table, along with monthly indexes (seasonal relatives), which are supplied to the dealer by the regional distributor.
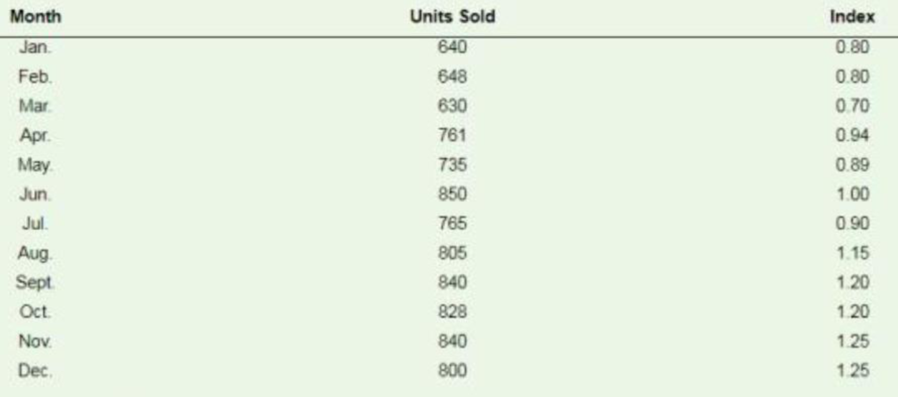
a. Plot the data Dow there seem to be a trend?
b. Deseasonalize car sales.
c. Plot ihe deteasorulized data on the same graph as the original data Comment on the two graphs
d. Assuming no proactive approach on the part of management, discuss (no calculations necessary how you wiould
e. What action might management consider based on your findings m part b?
Expert Solution & Answer
Want to see the full answer?
Check out a sample textbook solution
Students have asked these similar questions
3. A large Portland manufacturing would like to forecast the monthly demand for a piece of pollutioncontrol equipment. Suppose the monthly sales figures for the past five months have been as follows:Month 1 2 3 4 5Actual Demand 14 17 20 21 25a. Make a forecast for 6th month using a three-period moving average (MA). What would be the forecastfor 6th month?b. The manager would like to use simple exponential smoothing to forecast. Use alpha = 0.25. Whatwould be the forecast for 6th month?c. Find the better forecast out of Moving Average and Simple Exponential Smoothing
Please help with the correct answers in details:
Centerville Bikes and Stuff (CBS) sells motorcycles and accessories. The number of helmets sold by CBS per week for the past six weeks follows.
Week
1
2
3
4
5
6
Value
19
14
17
12
18
15
a) Develop the three-week moving average for this time series. (Round your answers to two decimal places.)
Week
Time SeriesValue
Forecast
1
19
2
14
3
17
4
12
5
18
6
15
What is Compute MSE? (Round your answer to two decimal places.)
MSE = ?
What is the forecast for week 7?
b) Use ? = 0.2 to compute the exponential smoothing values for the time series.
Week
Time SeriesValue
Forecast
1
19
2
14
3
17
4
12
5
18
6
15
What is Compute MSE. (Round your answer to two decimal places.)
MSE = ?
What is the forecast for week 7? (Round your answer to two decimal places.)
c) Use ? = 0.4 to compute the exponential smoothing values for the time series.
Week
Time SeriesValue
Forecast
1…
The following table shows the actual demand observed over the last 11 years:
Year
1
2
3
4
5
6
7
8
9
10
11
Demand
6
8
4
9
13
8
11
14
9
13
7
Part 2
Using exponential smoothing with
α
=
0.40
and a forecast for year 1 of
5.0,
provide the forecast from periods 2 through 12 (round your responses to one decimal place).
Year
1
2
3
4
5
6
7
8
9
10
11
12
Forecast
5.0
enter your response here
enter your response here
enter your response here
enter your response here
enter your response here
enter your response here
enter your response here
enter your response here
enter your response here
enter your response here
enter your response here
Chapter 3 Solutions
EBK OPERATIONS MANAGEMENT
Ch. 3.15 - Prob. 1.1RQCh. 3.15 - Prob. 1.2RQCh. 3.15 - Prob. 1.3RQCh. 3 - What are the main advantage that quantitative...Ch. 3 - What are some of the consequences of poor...Ch. 3 - List the specific weaknesses of each of these...Ch. 3 - Forecasts are generally wrong a. Why are forecasts...Ch. 3 - What is the purpose of establishing control limits...Ch. 3 - What factors would you consider in deciding...Ch. 3 - Contrast the use of MAD and MSE in evaluating...
Ch. 3 - What advantages as a forecasting tool does...Ch. 3 - How does the number of periods in a moving average...Ch. 3 - What factors enter into the choice of a value for...Ch. 3 - Prob. 11DRQCh. 3 - Explain how using a centered moving average with a...Ch. 3 - Contrast the terms sales and demand.Ch. 3 - Contrast the reactive and proactive approaches to...Ch. 3 - Explain how flexibility in production systems...Ch. 3 - How is forecasting in the context of a supply...Ch. 3 - Which type of forecasting approach, qualitative or...Ch. 3 - Prob. 18DRQCh. 3 - Choose the type of forecasting technique (survey,...Ch. 3 - Explain the trade-off between responsiveness and...Ch. 3 - Who needs to be involved in preparing forecasts?Ch. 3 - How has technology had an impact on forecasting?Ch. 3 - It has been said that forecasting using...Ch. 3 - What capability would an organization have to have...Ch. 3 - When a new business is started, or a patent idea...Ch. 3 - Discuss how you would manage a poor forecast.Ch. 3 - Omar has beard from some of his customers that...Ch. 3 - Give three examples of unethical conduct involving...Ch. 3 - A commercial baker, has recorded sales (in dozens)...Ch. 3 - National Scan, Inc., sells radio frequency...Ch. 3 - A dry cleaner uses exponential smoothing to...Ch. 3 - An electrical contractors records during the last...Ch. 3 - A cosmetics manufacturers marketing department has...Ch. 3 - Prob. 6PCh. 3 - Freight car loadings ova a 12-year period at a...Ch. 3 - Air travel on Mountain Airline for the past 18...Ch. 3 - a. Obtain the linear trend equation for the...Ch. 3 - After plotting demand for four periods, an...Ch. 3 - A manager of a store that sells and installs spas...Ch. 3 - The following equation summarizes the trend...Ch. 3 - Compute seasonal relatives for this data the SA...Ch. 3 - A tourist center is open on weekends (Friday,...Ch. 3 - The manager of a fashionable restaurant open...Ch. 3 - Obtain estimates of daily relatives for the number...Ch. 3 - A pharmacist has been monitoring sales of 2...Ch. 3 - New car sales for a dealer in Cook County,...Ch. 3 - The following table shows a tool and die companys...Ch. 3 - An analyst must decide between two different...Ch. 3 - Two different forecasting techniques (F1 and F2)...Ch. 3 - Two independent methods of forecasting based on...Ch. 3 - Long-Life Insurance has developed a linear model...Ch. 3 - Timely Transport provides local delivery service...Ch. 3 - The manager of a seafood restaurant was asked to...Ch. 3 - The following data were collected during a study...Ch. 3 - Lovely Lawns Inc., intends to use sales of lawn...Ch. 3 - The manager of a travel agency has been using a...Ch. 3 - Refer to the data in problem 22 a. Compute a...Ch. 3 - The classified department of a monthly magazine...Ch. 3 - A textbook publishing company has compiled data on...Ch. 3 - A manager has just receded an valuation from an...Ch. 3 - A manager uses this equation to predict demand for...Ch. 3 - A manager uses a trend equation plus quarterly...Ch. 3 - ML MANUFACTURING ML Manufacturing makes various...Ch. 3 - ML MANUFACTURING ML Manufacturing makes various...Ch. 3 - HIGHLINE FINANCIAL SERVICES, LTD. Highline...
Knowledge Booster


Learn more about
Need a deep-dive on the concept behind this application? Look no further. Learn more about this topic, operations-management and related others by exploring similar questions and additional content below.Similar questions
- Under what conditions might a firm use multiple forecasting methods?arrow_forwardIN THE MID-1960S, WALT DISNEY’S DREAM was to build a family resort destination like no other. Thedream became a reality when Walt Disney World Resort opened in 1971, featuring Magic Kingdom asthe centerpiece. Today, millions of guests visit the Walt Disney World Resort each year to experience theworld-class theme parks and hotels. Analytics feature prominently in the operations of Walt DisneyWorld. 1. Explain using illustrations how forecasting features in this company’s operations.2. Explain at least four methods of forecasting that can be used for Disney’s purpose.arrow_forwardGargash Car Service have repaired the following number of cars from January to May. Month Number of cars sold January 120 February 123 March 145 April 141 May 138 A. Calculate the three-period moving average forecast for the month of June. Show your work.8. Given the historical data and weights of 0.42, 0.33, and 0.25, calculate three-period weighted moving average forecast for June? Show your work.C. Calculate the naive forecast for June. Show your work.D. Would you prefer any of these forecasts above the other? Justify your answer.E. Suppose that the June's actual sales is 5 percent lower than May's sales. What will the error of your(preferred) forecast?arrow_forward
- Given the following demand data, Period Demand 1 47 2 44 3 47 4 44 5 48 a. Compute a weighted average forecast using a weight of 0.4 for the most recent period, 0.3 for the next most recent, 0.2 for the next, and 0.1 for the next. (Round all your answers to two decimal points.) b. If the actual demand for period 6 is 48, forecast demand for period 7 using the same weights as in part a. Forecast Period 7 ______arrow_forwardThe following table shows the actual demand observed over the last 11 years: Year 1 2 3 4 5 6 7 8 9 10 11 Demand 6 8 4 9 13 8 11 14 9 13 7 Part 2 Using exponential smoothing with α = 0.40 and a forecast for year 1 of 5.0, provide the forecast from periods 2 through 12 (round your responses to one decimal place). Year 1 2 3 4 5 6 7 8 9 10 11 12 Forecast 5.0 5.45.4 6.46.4 5.55.5 6.96.9 9.39.3 8.88.8 9.79.7 11.411.4 10.410.4 11.511.5 9.79.7 Part 3 Provide the forecast from periods 2 through 12 using the naive approach (enter your responses as whole numbers). Year 2 3 4 5 6 7 8 9 10 11 12 Forecast enter your response here enter your response here enter your response here enter your…arrow_forwardUsing data in the below in class example, forecast GA operations using effective buying income (X2) as the independent variable. Develop forecasts for the years 2010, 2015, 2020 and 2030. Show your answers in a table. Questions: How does this forecast differ from that using employment as the independent variable? What is the coefficient of determination for this scenario and what does it imply? Service Area Year GA Operations (Y) Employment (X1) Effective Buying Income (X2) 2000 22,513 45,714 $8,433 2001 23,768 48,601 $9,207 2002 21,838 51,314 $10,106 2003 25,904 54,107 $10,457 2004 26,208 57,848 $11,055 2005 26,946 56,022 $11,016 2006 27,977 56,317 $11,399 2007 27,294 58,757 $11,883 2008 28,647 61,556 $12,119 2009 29,270 62,341 $12,213 Forecast 2010 66,533 $13,081 2015 73,491 $14,609 2020 82,189 $16,525 2030 99,584…arrow_forward
- Sales of tablet computers at Ted Glickman's electronicsstore in Washington, D.C., over the past 10 weeks are shownin the ta ble below: a) Forecast demand for each week, including week 10, usingexponential smoothing with a = .5 (in itial forecast = 20).b) Compute the MAD.c) Compute the tracking signal.arrow_forwardInterpret the MAD of the most accurate among the forecasting models below. A. Naïve approach;B. 5-month SMA model;C. WMA model with weights 0.1, 0.3, and 0.6; orD. ES model with α = 0.5 and a forecast of 3,500 liters in the first month.arrow_forwardThe accompanying dataset provides the closing prices for four stocks and the stock exchange over 12 days. Complete parts a through c. a. Use Excel's Data Analysis Exponential Smoothing tool to forecast each of the stock prices using simple exponential smoothing with a smoothing constant of 0.3. Complete the exponential smoothing forecast model for stock A. (Type integers or decimals rounded to two decimal places as needed.) Date Forecast A 09/03/2010 09/07/2010 enter your response here 09/08/2010 enter your response here 09/09/2010 enter your response here 09/10/2010 enter your response here 09/13/2010 enter your response here 09/14/2010 enter your response here 09/15/2010 enter your response here 09/16/2010 enter your response here 09/17/2010 enter your response here 09/20/2010 enter your response here 09/21/2010 enter your response here Date A B C D Stock Exchange…arrow_forward
- Can you please demonstrate #7 how to identify the coefficient? Given: Year Demand 1 7 2 9 3 5 4 9 5 Predict the value for Year 5: 2 year moving average What is MSE for 2 year moving average? 2 year moving average using 0.6 (weight for the oldest period) and 0.4(weight for most recent period Exponential smoothing, =0.2 and forecast for Year 1 = 5 Linear trend Which forecast method has the least amount of error using MAD? What is the coefficient?arrow_forwardThe worksheet Hudson Demand Case Data in MindTap provides the number of visits over one year from January to December (52 weeks). Chart the data and explain the characteristics of the time series. How would you forecast future demand for customer visits? What criteria will you use to determine a “good” forecast? What methods would you use, and why? What is your final recommendation with respect to a forecasting method? Note:- Do not provide handwritten solution. Maintain accuracy and quality in your answer. Take care of plagiarism. Answer completely. You will get up vote for sure.arrow_forwardSales of quilt covers at Bud Banis' department store in Carbondale over the past year are shown below. Management prepared a forecast using a combination of exponential smoothing and its collective judgment for the 4 months (March, April, May, and June): a) Compute MAD and MAPE for management's technique.b) Do management's results outperform (i.e., have smaller MAD and MAPE than) a naive forecast?c) Which forecast do you recommend, based on lower forecast error?arrow_forward
arrow_back_ios
SEE MORE QUESTIONS
arrow_forward_ios
Recommended textbooks for you
 Contemporary MarketingMarketingISBN:9780357033777Author:Louis E. Boone, David L. KurtzPublisher:Cengage Learning
 MarketingMarketingISBN:9780357033791Author:Pride, William MPublisher:South Western Educational Publishing
Contemporary Marketing
Marketing
ISBN:9780357033777
Author:Louis E. Boone, David L. Kurtz
Publisher:Cengage Learning
Marketing
Marketing
ISBN:9780357033791
Author:Pride, William M
Publisher:South Western Educational Publishing
Forecasting 2: Forecasting Types & Qualitative methods; Author: Adapala Academy & IES GS for Exams;https://www.youtube.com/watch?v=npWni9K6Z_g;License: Standard YouTube License, CC-BY
Introduction to Forecasting - with Examples; Author: Dr. Bharatendra Rai;https://www.youtube.com/watch?v=98K7AG32qv8;License: Standard Youtube License