
EBK OPERATIONS MANAGEMENT
14th Edition
ISBN: 9781260718447
Author: Stevenson
Publisher: MCG COURSE
expand_more
expand_more
format_list_bulleted
Concept explainers
Videos
Textbook Question
Chapter 3, Problem 20P
An analyst must decide between two different
Expert Solution & Answer
Want to see the full answer?
Check out a sample textbook solution
Students have asked these similar questions
All forecasting methods using exponential smoothing, adaptive smoothing, and exponential smoothing including trend require starting values to get the equations going. How would you select the starting value for, say, Ft−1?
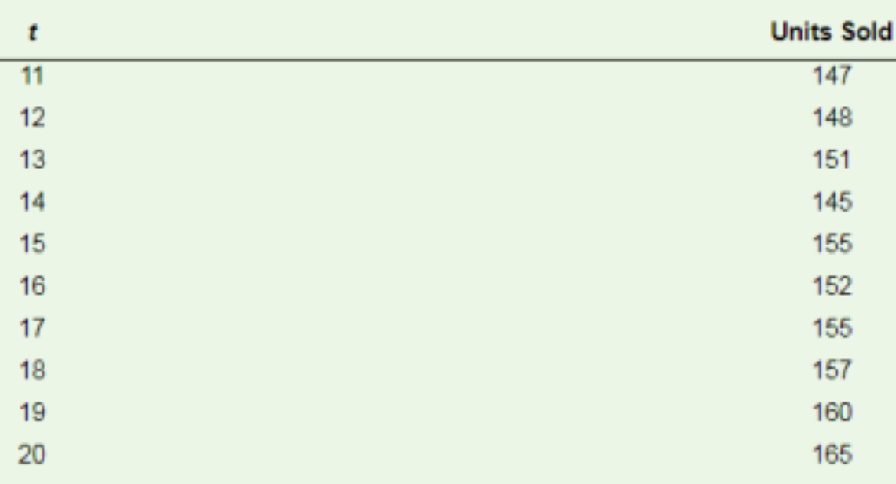
An analyst must decide between two different forecasting techniques for weekly sales of rollerblades: a linear trend equation and the naive approach. The linear trend equation is Ft= 124 + 2t,and it was developed using data from periods 1 through 10. Based on data for periods 11 through20 as shown in the table, which of these two methods has the greater accuracy if MAD and MSEare used?t Units Sold11 14712 14813 15114 14515 15516 15217 15518 15719 16020 165
The past two years sales at ACSR Inc. were 3 million and 5 million. Their forecast
team used a two-period moving average to forecast its sales this year. But the actual
sales for this year were 5 million. Now, the forecast team wants to forecast its sales for
next year by using exponential smoothing with alpha equals 0.6.
What is the forecast using exponential smoothing with alpha = .6?
2. If we decide to use an alpha of .2 instead of .6, will we be ‘weighting the error from the previous period higher or the Forecast from the previous
period higher? Explain briefly or show using math!
(In this question I am asking if we change the alpha to a lower alpha, what will be the effect – what will we be ‘weighing’ as more important?)
Chapter 3 Solutions
EBK OPERATIONS MANAGEMENT
Ch. 3.15 - Prob. 1.1RQCh. 3.15 - Prob. 1.2RQCh. 3.15 - Prob. 1.3RQCh. 3 - What are the main advantage that quantitative...Ch. 3 - What are some of the consequences of poor...Ch. 3 - List the specific weaknesses of each of these...Ch. 3 - Forecasts are generally wrong a. Why are forecasts...Ch. 3 - What is the purpose of establishing control limits...Ch. 3 - What factors would you consider in deciding...Ch. 3 - Contrast the use of MAD and MSE in evaluating...
Ch. 3 - What advantages as a forecasting tool does...Ch. 3 - How does the number of periods in a moving average...Ch. 3 - What factors enter into the choice of a value for...Ch. 3 - Prob. 11DRQCh. 3 - Explain how using a centered moving average with a...Ch. 3 - Contrast the terms sales and demand.Ch. 3 - Contrast the reactive and proactive approaches to...Ch. 3 - Explain how flexibility in production systems...Ch. 3 - How is forecasting in the context of a supply...Ch. 3 - Which type of forecasting approach, qualitative or...Ch. 3 - Prob. 18DRQCh. 3 - Choose the type of forecasting technique (survey,...Ch. 3 - Explain the trade-off between responsiveness and...Ch. 3 - Who needs to be involved in preparing forecasts?Ch. 3 - How has technology had an impact on forecasting?Ch. 3 - It has been said that forecasting using...Ch. 3 - What capability would an organization have to have...Ch. 3 - When a new business is started, or a patent idea...Ch. 3 - Discuss how you would manage a poor forecast.Ch. 3 - Omar has beard from some of his customers that...Ch. 3 - Give three examples of unethical conduct involving...Ch. 3 - A commercial baker, has recorded sales (in dozens)...Ch. 3 - National Scan, Inc., sells radio frequency...Ch. 3 - A dry cleaner uses exponential smoothing to...Ch. 3 - An electrical contractors records during the last...Ch. 3 - A cosmetics manufacturers marketing department has...Ch. 3 - Prob. 6PCh. 3 - Freight car loadings ova a 12-year period at a...Ch. 3 - Air travel on Mountain Airline for the past 18...Ch. 3 - a. Obtain the linear trend equation for the...Ch. 3 - After plotting demand for four periods, an...Ch. 3 - A manager of a store that sells and installs spas...Ch. 3 - The following equation summarizes the trend...Ch. 3 - Compute seasonal relatives for this data the SA...Ch. 3 - A tourist center is open on weekends (Friday,...Ch. 3 - The manager of a fashionable restaurant open...Ch. 3 - Obtain estimates of daily relatives for the number...Ch. 3 - A pharmacist has been monitoring sales of 2...Ch. 3 - New car sales for a dealer in Cook County,...Ch. 3 - The following table shows a tool and die companys...Ch. 3 - An analyst must decide between two different...Ch. 3 - Two different forecasting techniques (F1 and F2)...Ch. 3 - Two independent methods of forecasting based on...Ch. 3 - Long-Life Insurance has developed a linear model...Ch. 3 - Timely Transport provides local delivery service...Ch. 3 - The manager of a seafood restaurant was asked to...Ch. 3 - The following data were collected during a study...Ch. 3 - Lovely Lawns Inc., intends to use sales of lawn...Ch. 3 - The manager of a travel agency has been using a...Ch. 3 - Refer to the data in problem 22 a. Compute a...Ch. 3 - The classified department of a monthly magazine...Ch. 3 - A textbook publishing company has compiled data on...Ch. 3 - A manager has just receded an valuation from an...Ch. 3 - A manager uses this equation to predict demand for...Ch. 3 - A manager uses a trend equation plus quarterly...Ch. 3 - ML MANUFACTURING ML Manufacturing makes various...Ch. 3 - ML MANUFACTURING ML Manufacturing makes various...Ch. 3 - HIGHLINE FINANCIAL SERVICES, LTD. Highline...
Knowledge Booster


Learn more about
Need a deep-dive on the concept behind this application? Look no further. Learn more about this topic, operations-management and related others by exploring similar questions and additional content below.Similar questions
- Under what conditions might a firm use multiple forecasting methods?arrow_forwardThe Baker Company wants to develop a budget to predict how overhead costs vary with activity levels. Management is trying to decide whether direct labor hours (DLH) or units produced is the better measure of activity for the firm. Monthly data for the preceding 24 months appear in the file P13_40.xlsx. Use regression analysis to determine which measure, DLH or Units (or both), should be used for the budget. How would the regression equation be used to obtain the budget for the firms overhead costs?arrow_forwardThe file P13_42.xlsx contains monthly data on consumer revolving credit (in millions of dollars) through credit unions. a. Use these data to forecast consumer revolving credit through credit unions for the next 12 months. Do it in two ways. First, fit an exponential trend to the series. Second, use Holts method with optimized smoothing constants. b. Which of these two methods appears to provide the best forecasts? Answer by comparing their MAPE values.arrow_forward
- The file P13_29.xlsx contains monthly time series data for total U.S. retail sales of building materials (which includes retail sales of building materials, hardware and garden supply stores, and mobile home dealers). a. Is seasonality present in these data? If so, characterize the seasonality pattern. b. Use Winters method to forecast this series with smoothing constants = = 0.1 and = 0.3. Does the forecast series seem to track the seasonal pattern well? What are your forecasts for the next 12 months?arrow_forwardThe owner of a restaurant in Bloomington, Indiana, has recorded sales data for the past 19 years. He has also recorded data on potentially relevant variables. The data are listed in the file P13_17.xlsx. a. Estimate a simple regression equation involving annual sales (the dependent variable) and the size of the population residing within 10 miles of the restaurant (the explanatory variable). Interpret R-square for this regression. b. Add another explanatory variableannual advertising expendituresto the regression equation in part a. Estimate and interpret this expanded equation. How does the R-square value for this multiple regression equation compare to that of the simple regression equation estimated in part a? Explain any difference between the two R-square values. How can you use the adjusted R-squares for a comparison of the two equations? c. Add one more explanatory variable to the multiple regression equation estimated in part b. In particular, estimate and interpret the coefficients of a multiple regression equation that includes the previous years advertising expenditure. How does the inclusion of this third explanatory variable affect the R-square, compared to the corresponding values for the equation of part b? Explain any changes in this value. What does the adjusted R-square for the new equation tell you?arrow_forwardThe file P13_26.xlsx contains the monthly number of airline tickets sold by the CareFree Travel Agency. a. Create a time series chart of the data. Based on what you see, which of the exponential smoothing models do you think will provide the best forecasting model? Why? b. Use simple exponential smoothing to forecast these data, using a smoothing constant of 0.1. c. Repeat part b, but search for the smoothing constant that makes RMSE as small as possible. Does it make much of an improvement over the model in part b?arrow_forward
- The file P13_22.xlsx contains total monthly U.S. retail sales data. While holding out the final six months of observations for validation purposes, use the method of moving averages with a carefully chosen span to forecast U.S. retail sales in the next year. Comment on the performance of your model. What makes this time series more challenging to forecast?arrow_forwardThe file P13_28.xlsx contains monthly retail sales of U.S. liquor stores. a. Is seasonality present in these data? If so, characterize the seasonality pattern. b. Use Winters method to forecast this series with smoothing constants = = 0.1 and = 0.3. Does the forecast series seem to track the seasonal pattern well? What are your forecasts for the next 12 months?arrow_forwardThe file P13_02.xlsx contains five years of monthly data on sales (number of units sold) for a particular company. The company suspects that except for random noise, its sales are growing by a constant percentage each month and will continue to do so for at least the near future. a. Explain briefly whether the plot of the series visually supports the companys suspicion. b. By what percentage are sales increasing each month? c. What is the MAPE for the forecast model in part b? In words, what does it measure? Considering its magnitude, does the model seem to be doing a good job? d. In words, how does the model make forecasts for future months? Specifically, given the forecast value for the last month in the data set, what simple arithmetic could you use to obtain forecasts for the next few months?arrow_forward
- The number of fishing rods selling each day is given below. Perform analyses of the time series to determine which model should be used for forecasting. 3 day moving average analysis 4 day moving average analysis 3 day weighted moving average analysis with weights W1=0.2, W2=0.3 and W3=0.5 with W1 on the oldest data. Exponential smoothing analysis with A=0.3 Which model provides a better fit of the data? Forecast day 13 sales of fishing rods using the model chosen in part (e) Day Rods Sold 1 60 2 70 3 110 4 80 5 70 6 85 7 115 8 105 9 65 10 75 11 95 12 85 Please read the relevant article, found in the VLE, before answering the question. Discuss the process and findings of the study of the article. Suggest a possible study that could be done at your current or past job that could use a similar methodology and analysis.arrow_forwardComplete the forecasting worksheets for: Naïve Average Moving Average Weighted Moving Average using the weights of .8, .15, and .05 with .8 being the most current, then .15, then .05 ExponA using and alpha level of .75 ExponB will automatically be .25 when A is .75 Exponential Solver What is the best alpha level as determined by the Exponential Solver? Which is the best forecasting option for MAE? What is the MAE? Which is the best forecasting option for MAPE? What is the MAPE? Period Sales 1 115 2 118 3 128 4 122 5 135 6 128 7 135 8 132 9 132 10 135arrow_forwardUse the trend projection method, and the trend projection with seasonal adjustment method to create forecasting models in Excel. Next, using the two models, compute the forecasted values of monthly total passengers between 2010 to 2012 Compare the above two models using MAD, MSE, and MAPE Please explain which of the two models is performing better and why? Use the best model to forecast the monthly total passengers for year 2013arrow_forward
arrow_back_ios
SEE MORE QUESTIONS
arrow_forward_ios
Recommended textbooks for you
 Practical Management ScienceOperations ManagementISBN:9781337406659Author:WINSTON, Wayne L.Publisher:Cengage,
 Contemporary MarketingMarketingISBN:9780357033777Author:Louis E. Boone, David L. KurtzPublisher:Cengage Learning
 MarketingMarketingISBN:9780357033791Author:Pride, William MPublisher:South Western Educational Publishing
Practical Management Science
Operations Management
ISBN:9781337406659
Author:WINSTON, Wayne L.
Publisher:Cengage,
Contemporary Marketing
Marketing
ISBN:9780357033777
Author:Louis E. Boone, David L. Kurtz
Publisher:Cengage Learning
Marketing
Marketing
ISBN:9780357033791
Author:Pride, William M
Publisher:South Western Educational Publishing
Single Exponential Smoothing & Weighted Moving Average Time Series Forecasting; Author: Matt Macarty;https://www.youtube.com/watch?v=IjETktmL4Kg;License: Standard YouTube License, CC-BY
Introduction to Forecasting - with Examples; Author: Dr. Bharatendra Rai;https://www.youtube.com/watch?v=98K7AG32qv8;License: Standard Youtube License