Videos
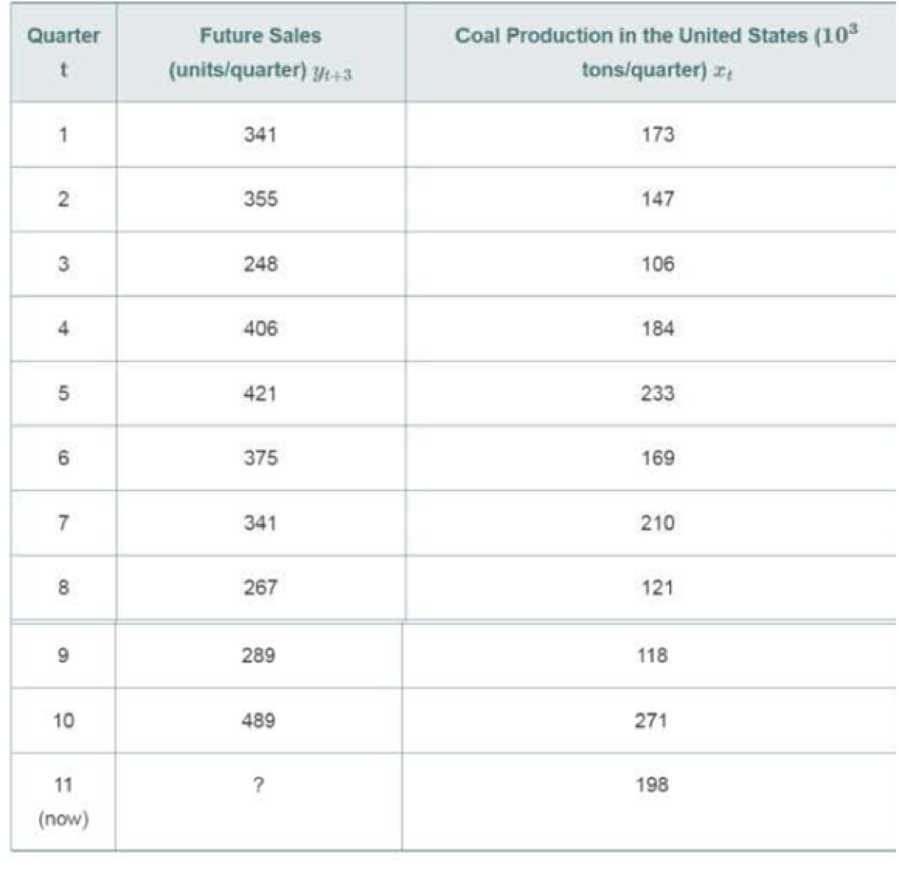
A company that manufactures shuttle cars and mines for the coal mining industry has determined that “coal production in the U.S.” is a fairly reliable three-quarter leading indicator of their sales. This quarter’s coal production in the United States can be obtained from the Department of Energy and it is used to obtain a
Want to see the full answer?
Check out a sample textbook solution
Chapter 3 Solutions
Pearson eText for Engineering Economy -- Instant Access (Pearson+)
Additional Business Textbook Solutions
Principles of Economics (12th Edition)
Principles of Economics, 7th Edition (MindTap Course List)
Economics of Money, Banking and Financial Markets, The, Business School Edition (4th Edition) (The Pearson Series in Economics)
Foundations of Economics (8th Edition)
Microeconomics
ECON: MICRO4 (New, Engaging Titles from 4LTR Press)


- The forecasting staff for the Prizer Corporation has developed a model to predict sales of its air-cushioned-ride snowmobiles. The model specifies that sales S vary jointly with disposable personal income Y and the population between ages 15 and 40, Z, and inversely with the price of the snowmobiles P. Based on past data, the best estimate of this relationship is S=kYZP where k has been estimated (with past data) to equal 100. If Y=11,000,Z=1,200, and P=20,000, what value would you predict for S? What happens if P is reduced to $17,500? How would you go about developing a value for k? What are the potential weaknesses of this model?arrow_forwardSavings-Mart (a chain of discount department stores) sells patio and lawn furniture. Sales are seasonal, with higher sales during the spring and summer quarters and lower sales during the fall and winter quarters. The company developed the following quarterly sales forecasting model: Y t=8.25+0.125t2.75D1t+3.50D3t where Y t=predictedsales(million)inquartert 8.25=quarterlysales(million)whent=0 t=timeperiod(quarter)wherethefourthquarterof2002=0,firstquarterof2003=1,secondquarterof2003=2,... D1t={1forfirst-quarterobservations0otherwiseD2t={1forsecond-quarterobservations0otherwiseD3t={1forthird-quarterobservations0otherwise Forecast Savings-Marts sales of patio and lawn furniture for each quarter of 2010.arrow_forwardA forecaster used the regression equation Qt= a + bt+q₁D₁ + C2D2 + c3D3 and quarterly sales data for 2004/-2021/V (t = 1, ..., 64) for an appliance manufacturer to obtain the results shown below. Q is quarterly sales, and D1, D₂ and D3 are dummy variables for quarters I, II, and III. DEPENDENT VARIABLE: QT R-SQUARE OBSERVATIONS: 64 0.8768 VARIABLE INTERCEPT T D1 D2 D3 F-RATIO P-VALUE ON F 107.982 0.0001 PARAMETER STANDARD ESTIMATE 30.0 1.5 10.0 25.0 40.0 ERROR T-RATIO P-VALUE 2.34 0.0224 2.14 0.0362 3.33 0.0015 3.47 0.0010 2.53 0.0140 12.80 0.70 3.00 7.20 15.80 In any given year, quarterly sales tend to vary as follows:arrow_forward
- Q4. The Omantel firm has estimate the Sales of fibre internet connections in Oman with the related to advertising expenditure made by the company over the past 26 months. Following is the firm estimated results of the regression equation. DEPENDENT VARIABLE: Y R-SQUARE F-RATIO P-VALUE ON F OBSERVATIONS: 26 0.85121212 8.747 0.0187 PARAMETER STANDARD VARIABLE ESTIMATE ERROR T-RATIO P-VALUE INTERCEPT 7.6 6.33232 1.200 0.2643969 3.53 0.52228 ? 0.0001428 a. What is the dependent and independent variables in the above regression equation of Omantel firm? b. Calculate the estimated t-ratio. Test the slope estimates for statistical significance at the 10 percent significance level. d. Interpret the coefficient of determination.arrow_forwardеВook Cox Electric makes electronic components and has estimated the following for a new design of one of its products: Fixed Cost = $13,000 Material cost per unit = $0.15 Labor cost per unit = $0.10 Revenue per unit = $0.65 Production Volume - 12,000 Per-unit material and labor cost together make up the variable cost per unit. Assuming that Cox Electric sells all it produces, build a spreadsheet model that calculates the profit by subtracting the fixed cost and total variable cost from total revenue, and answer the following questions. (a) Construct a one-way data table with production volume as the column input and profit as the output. Breakeven occurs when profit goes from a negative to a positive value; that is, breakeven is when total revenue = total cost, yielding a profit of zero. Vary production volume from 5,000 to 50,000 in increments of 5,000. In which interval of production volume does breakeven occur? to units (b) Use Goal Seek to find the exact breakeven point. Assign…arrow_forwardDetermine the mode choice (personal vehicle or bus system) for the following regression model: Utility Function: Umode – (8.333 x 10⁻⁴)*(Access time in sec) – (6.667 x 10⁻⁴)*(Wait Time in sec) – (5.00 x 10⁻⁴)*(Riding time in sec) – (1.40)*(Cost, $) PARAMETER PERSONAL VEHICLE CITY BUS SYSTEM MODE CONSTANT -0.01 -0.07 ACCESS TIME (SECS) 300 600 WAITING TIME (SECS) 0 900 RIDING TIME (SECS) 1,500 6,000 COST (DOLLARS) $1.50 $1.00arrow_forward
- You are the manager of a firm that produces a vegetable cooking oil in Ghana. In order to make informed decision, you engaged an economist to estimate the demand equation for your product. Using data from 25 supermarkets around the country for the month of February, 2021, the estimated linear regression result for your product is shown in the table below: Variable Constant Parameter Estimates Standard error -164.0 20.24 Price of vegetable cooking oil (P,) Price of palm oil (P,) Per capita Income () -3.50 1.55 2,50 0.28 0.45 0.52 R-squared 0.8672 Adjusted R-squared 0.8132 F-statistic 15.6893 a) Suppose the average price of 3 gallons of vegetable cooking oil is GH¢12, price of 2 gallons of palm oil is GH¢60, the per capita income of Ghana is GH¢420. i. Write down the estimated demand equation for your firm's product and interpret the parameter estimates. ii. Detemine the quantity of vegetable cooking oil sold. Estimate the own price elasticity of demand and state the type of demand curve…arrow_forwardFind the regression equation, letting the first variable be the predictor (x) variable. Using the listed actress/actor ages in various years, find the best predicted age of the Best Actor winner given that the age of the Best Actress winner that year is 43 years. Is the result within 5 years of the actual Best Actor winner, whose age was 45 years? Best Actress 27 30 30 61 30 32 46 28 61 22 43 56 D Best Actor 42 39 38 45 51 49 59 51 38 57 45 34 Find the equation of the regression line. y = + (Round the constant to one decimal place as needed. Round the coefficient to three decimal places as needed.) The best predicted age of the Best Actor winner given that the age of the Best Actress winner that year is 43 years is years old. (Round to the nearest whole number as needed.) Is the result within 5 years of the actual Best Actor winner, whose age was 45 years? the predicted age is the actual winner's age.arrow_forwardConsider the following estimated regression for 220 home sales from a community in 2019 (estimated standard errors in parentheses) Price = 119.2 + 0.485BDR + 23.4Bath + 0.156Hsize + 0.002Lsize + 0.09Age (0.011) (2.61) (8.94) (0.00048) (0.311) R2 = 0.72 where Price denote the selling house price (measured in $1000s), BDR denote the number of bedrooms, Bath denote the number of bathrooms, Hsize denote the size of the house (in square feet), Lsize denote the lot size (in square feet), and Age denote the age of the house (in years).arrow_forward
- Thirty data points on Y and X are employed to estimate the parameters in the linear relation Y = a + bX. The computer output from the regression analysis is DEPENDENT VARIABLE: R-SQUARE F-RATIO P-VALUE ON F OBSERVATIONS: 30 0.5300 13.79 0.0009 VARIABLE PARAMETER STANDARD T-RATIO P-VALUE ESTIMATE ERROR INTERCEPT 93.54 46.210 2.02 0.0526 -3.25 0.875 -3.71 0.0009 The percentage of the total variation in Y NOT explained by the regression is percent,arrow_forwardThe following question refers to this regression equation (standard errors for each of the estimated coefficients are in parenthesis). Q=8,400-8" P+5" A+ 4** Px +0.05**1, (1,732) (2.29) (1.36) (1.75) (0.15) Q = Quantity demanded P = Price 1,100 Advertising expenditures, in thousands = 20 P = price of competitor's good = 600/= average monthly income 10,000 What is the advertising elasticity of demand? Round your answer to two decimal places. Your Answer: The t-statistic is computed by dividing the regression coefficient by the standard error of the coefficient. dividing the regression coefficient by the standard error of the estimate. dividing the standard error of the coefficient by the regression coefficient. dividing the R2 by the F-statistic. none of the specified answers are correct.arrow_forwardIdentify the estimated simple linear regression equation. Answer O y = Bo+B1x1 + ẞ2x2 + € Oy Bo+B1x + € Oy bob₁x + ε ○ ŷ = bo+b₁xarrow_forward
 Managerial Economics: Applications, Strategies an...EconomicsISBN:9781305506381Author:James R. McGuigan, R. Charles Moyer, Frederick H.deB. HarrisPublisher:Cengage Learning