
Concept explainers
Videos
a.
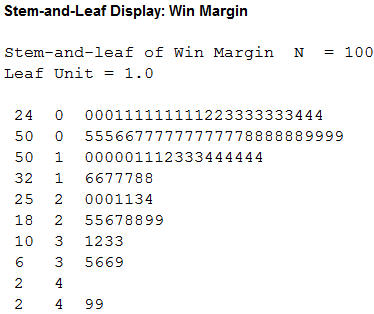
Construct the stem and leaf display.
a.
Answer to Problem 28CE
The stem and leaf display for RoseBowl data is given below:
Explanation of Solution
Calculation:
The given information is that, the data represents the margin of victory in each of the 100 Rose Bowl from 1902 through 2016.
Software procedure:
Step -by-step software procedure to draw stem-and-leaf plot using MINITAB software is as follows:
- Select Graph > Stem and leaf.
- Select the column of Win Margin in Graph variables.
- Click OK.
b.
Construct a frequency distribution.
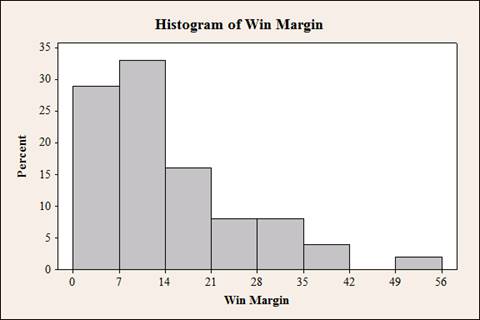
Construct a histogram.
b.
Answer to Problem 28CE
The frequency distribution using nice bin limits
| Bin limits | Mid point | Width |
Frequency | Percent | Cumulative | ||
| Lower | Upper | Frequency | Percent | ||||
| 0 | < 7 | 3.5 | 7 | 29 | 29 | 29 | 29 |
| 7 | < 14 | 10.5 | 7 | 33 | 33 | 62 | 62 |
| 14 | < 21 | 17.5 | 7 | 16 | 16 | 78 | 78 |
| 21 | < 28 | 24.5 | 7 | 8 | 8 | 86 | 86 |
| 28 | < 35 | 31.5 | 7 | 8 | 8 | 94 | 94 |
| 35 | < 42 | 38.5 | 7 | 4 | 4 | 98 | 98 |
| 42 | < 49 | 45.5 | 7 | 0 | 0 | 98 | 98 |
| 49 | < 56 | 52.5 | 7 | 2 | 2 | 100 | 100 |
| Total | 100 | ||||||
The histogram is as follows,
Explanation of Solution
Calculation:
Frequency distribution:
It is a tabulation of n data values which are divided into k classes called bins. The bin limits are the cutoff points which defines each bin. These generally have equal interval and the limits do not overlap.
Step-by-step procedure to construct frequency distribution table is as follows:
- The smallest and largest data values are 0 and 49.
- Here the sample size is 100. By Sturge’s Rule,
Thus,
- Bin width is obtained by dividing the
range by the number of bins.
Thus,
Hence, the bin width is 7.
- The minimum value in the data is 0 hence the first bin should start at 0.
Tally mark:
- Make a tally mark for each score in the corresponding class and continue for all reading times in the data.
- The number of tally marks in each class represents the frequency, f of that class.
Thus, the frequency distribution table for Callengths is as follows:
| Bin limits | Tally |
Frequency | Percent | |
| Lower | Upper | |||
| 0 | < 7 | 29 | ||
| 7 | < 14 | 33 | ||
| 14 | < 21 | 16 | ||
| 21 | < 28 | 8 | ||
| 28 | < 35 | 8 | ||
| 35 | < 42 | 4 | ||
| 42 | < 49 | 0 | ||
| 49 | < 56 | 2 | ||
| Total | 100 | |||
Mid point:
The midpoint is the average of the lower limit and upper limit of a particular class. It is also called as class mark.
Thus, the mid points for each class is tabulated below:
| Bin limits |
Frequency | Mid point | |
| Lower | Upper | ||
| 0 | < 7 | 29 | |
| 7 | < 14 | 33 | |
| 14 | < 21 | 16 | |
| 21 | < 28 | 8 | |
| 28 | < 35 | 8 | |
| 35 | < 42 | 4 | |
| 42 | < 49 | 0 | |
| 49 | < 56 | 2 | |
| Total | 100 | ||
Cumulative frequency:
Cumulative frequency is the running total of frequencies. A cumulative frequency for a particular class would be the total of all frequencies upto that current class The last class’s cumulative frequency is equal to the sample size
Thus, the cumulative frequency for each calss is tabulated below:
| Bin limits |
Frequency |
Cumulative frequency | |
| Lower | Upper | ||
| 0 | < 7 | 29 | 29 |
| 7 | < 14 | 33 | |
| 14 | < 21 | 16 | |
| 21 | < 28 | 8 | |
| 28 | < 35 | 8 | |
| 35 | < 42 | 4 | |
| 42 | < 49 | 0 | |
| 49 | < 56 | 2 | |
| Total | 100 | ||
Cumulative Relative frequency:
| Bin limits |
Cumulative frequency |
Cumulative percent | |
| Lower | Upper | ||
| 0 | < 7 | 29 | |
| 7 | < 14 | 62 | |
| 14 | < 21 | 78 | |
| 21 | < 28 | 86 | |
| 28 | < 35 | 94 | |
| 35 | < 42 | 98 | |
| 42 | < 49 | 98 | |
| 49 | < 56 | 100 | |
| Total | |||
Software procedure:
- Choose Graph > Histogram.
- Choose Simple, and then click OK.
- In Graph variables, enter the corresponding column of Win margin.
- Click Scale > Y-Scale Type > Percent
- Click OK.
- To modify the interval settings, double click on the horizontal axis of the graph. Then, select Binning > Cutpoint > Cutpoint Positions, in this box, enter the values for the cut points of the bin intervals (0, 7, 14, 21, 28, 35, 42, 49 and 56).
c.
Explain about the distribution and any unusual features.
c.
Explanation of Solution
Symmetric:
If the values of the data are elongated equally to the right and left, then the distribution is symmetric.
Skewed right:
If the values of the data are elongated to the right and most of the values are clustered on the left side, then the distribution is skewed right.
Skewed left:
If the values of the data are elongated to the left and most of the values are clustered on the right side, then the distribution is skewed left.
From the histogram in part (a) it is observed that, the shape of the distribution is heavily skewed right because the tail is elongated to the right. The range of the distribution lies between 0 and 49.
Want to see more full solutions like this?
Chapter 3 Solutions
APPLIED STAT.IN BUS.+ECONOMICS


 Glencoe Algebra 1, Student Edition, 9780079039897...AlgebraISBN:9780079039897Author:CarterPublisher:McGraw Hill
 Holt Mcdougal Larson Pre-algebra: Student Edition...AlgebraISBN:9780547587776Author:HOLT MCDOUGALPublisher:HOLT MCDOUGAL