
APPLIED STAT.IN BUS.+ECONOMICS
6th Edition
ISBN: 9781259957598
Author: DOANE
Publisher: RENT MCG
expand_more
expand_more
format_list_bulleted
Concept explainers
Videos
Textbook Question
Chapter 3.1, Problem 2SE
(a) Make a stem-and-leaf plot for the number of defects per 100 vehicles for these 32 brands. (b) Make a dot plot of the defects data. (c) Describe these two displays. (Hint: Refer to center, variability, and shape.)
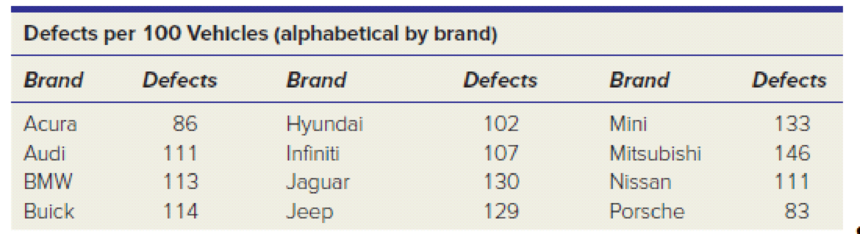
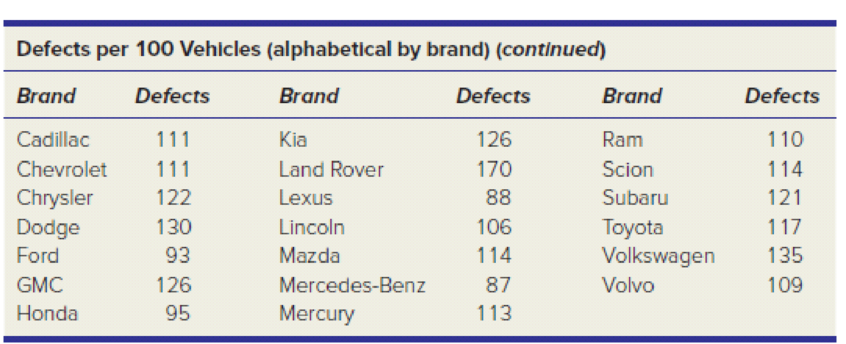
Source: J. D. Power and Associates 2010 Initial Quality StudyTM.
Expert Solution & Answer
Want to see the full answer?
Check out a sample textbook solution
Students have asked these similar questions
A manufacturing company is interested in predicting the number of defects that will be produced each hour on the assembly line. The managers believe that there is a relationship between the defect rate and the production rate per hour. The managers believe that they can use production rate to predict the number of defects. The following data were collected for 10 randomly selected hours.
Defects (Y)
Production rate per hour(X)
2
40
3
45
1
35
2
37
3
40
2
40
3
45
2
30
1
30
4
30
(a). Construct a scatter plot diagram and comment on the relationship between y and x
(b). Calculate the correlation coefficient (r) between x and y and comment on the result.
(c). Find the coefficient of determination and interpret the result.
A glass manufacturing company wanted to investigate the effect of breakoff pressure and stopper height on the percentage of breaking off chips. The results are in the accompanying table. Complete parts (a) through (e).
a. At the 0.01 level of significance is there an interaction between the breakoff pressure and the stopper height?
b. is there an effect due to the breakoff pressure?
c. is there an effect due to the stopper height?
d. Plot the percentage breakoff for each breakoff pressure for each stopper height.
e. Discuss the results of (a) through (d).
Calculate the effect size of the data below?
Chapter 3 Solutions
APPLIED STAT.IN BUS.+ECONOMICS
Ch. 3.1 - (a) Make a stem-and-leaf plot for these 24...Ch. 3.1 - (a) Make a stem-and-leaf plot for the number of...Ch. 3.1 - (a) Make a stacked dot plot to compare the lengths...Ch. 3.2 - (a) The table shows the number of days on the...Ch. 3.2 - (a) The table shows raw scores on a state civil...Ch. 3.2 - (a) Make a frequency distribution and histogram...Ch. 3.2 - (a) Make a frequency distribution and histogram...Ch. 3.2 - (a) Make a frequency distribution and histogram...Ch. 3.2 - For each frequency distribution, suggest nice...Ch. 3.2 - Below are sorted data showing average spending per...
Ch. 3.4 - (a) Use Excel to prepare a line chart to display...Ch. 3.4 - Prob. 12SECh. 3.4 - Prob. 13SECh. 3.4 - (a) Use Excel to prepare a line chart to display...Ch. 3.5 - Prob. 15SECh. 3.5 - The table shows the number of TVs sold by a major...Ch. 3.6 - (a) Use Excel to prepare a 2-D pie chart for these...Ch. 3.6 - Prob. 19SECh. 3.6 - Prob. 20SECh. 3.7 - (a) Use Excel to make a scatter plot of the data...Ch. 3.7 - Prob. 22SECh. 3.7 - Prob. 23SECh. 3.7 - (a) Use Excel to make a scatter plot of the data,...Ch. 3 - Name two attractive features and two limitations...Ch. 3 - (a) What is a frequency distribution? (b) What are...Ch. 3 - (a) What is a histogram? (b) What does it show?Ch. 3 - (a) What is a bimodal histogram? (b) Explain the...Ch. 3 - (a) What is a scatter plot? (b) What do scatter...Ch. 3 - For what kind of data would we use a bar chart?...Ch. 3 - For what kind of data would we use a line chart?...Ch. 3 - (a) List the three most common types of charts in...Ch. 3 - (a) For what kind of data would we use a pie...Ch. 3 - Which types of charts can be used for time series...Ch. 3 - (a) When might we need a log scale? (b) What do...Ch. 3 - When might we use a stacked column chart? An area...Ch. 3 - List five deceptive graphical techniques.Ch. 3 - What is a pivot table? Why is it useful?Ch. 3 - The durations (minutes) of 26 electric power...Ch. 3 - The U.S. Postal Service will ship a Priority Mail,...Ch. 3 - A study of 40 U.S. cardiac care centers showed the...Ch. 3 - Prob. 28CECh. 3 - An executives telephone log showed the following...Ch. 3 - Below are batting averages of the New York Yankees...Ch. 3 - Prob. 31CECh. 3 - Prob. 32CECh. 3 - Download the full data set from the McGraw-Hill...Ch. 3 - (a) What kind of display is this? (b) Identify its...Ch. 3 - (a) What kind of display is this? (b) Identify its...Ch. 3 - (a) What kind of display is this? (b) Identify its...Ch. 3 - (a) What kind of display is this? (b) Identify its...Ch. 3 - Prob. 38CECh. 3 - (a) What kind of display is this? (b) Identify its...Ch. 3 - (a) What kind of display is this? (b) Identify its...Ch. 3 - Prob. 41CECh. 3 - Prob. 42CECh. 3 - (a) Use Excel to prepare an appropriate type of...Ch. 3 - Prob. 44CECh. 3 - Prob. 45CECh. 3 - (a) Use Excel to prepare an appropriate type of...Ch. 3 - Prob. 47CECh. 3 - (a) Use Excel to prepare an appropriate type of...
Knowledge Booster


Learn more about
Need a deep-dive on the concept behind this application? Look no further. Learn more about this topic, statistics and related others by exploring similar questions and additional content below.Similar questions
- Given the raw data, create a box plot that would show central tendency and variability of data in each set. Provide a brief desciption of the box plot describing its results.arrow_forwardDescribe and compare the measurement of the central tendency and thedispersion of the electric usage before and after implementing the newelectric meter based on the histogram and box plots given.arrow_forwardA geologist collects hand-specimen sized pieces of limestone from a particular area. A qualitative assessment of both texture and color is made with the following results. Is there evidence of association between color and texture for these limestones? Explain your answer. Color Texture Light Medium Dark Fine 7 15 4 Medium 5 18 15 Coarse 17 29 5arrow_forward
- Construct a box plot from the given data use the approximation methodarrow_forwardA sample of wait times in minutes to be seated at two popular restaurants is shown. Use the data and the box-and-whisker plots to compare the data.arrow_forwardDescribe a set of data in which it would be most appropriate to use the mode as the measure of central tendency.arrow_forward
- a) Determine the values of * and **. b) Give the unbiased point estimate for the average monthly earning from Hyundai Vehicles. c) Give the unbiased point estimate for the variance of monthly earning from Hyundai Vehicles.arrow_forwarda) Determine the values of * and **. b) Give the unbiased point estimate for the average monthly earning from Hyundai Vehicles.c) Give the unbiased point estimate for the variance of monthly earning from Hyundai Vehicles.arrow_forwardPresent and interpret the given data using any of the graphical methods of presenting data.arrow_forward
- 6) part 4. Generate a abo plot for the asteroid data.arrow_forwardA statistical program is recommended. The accompanying data resulted from a study of the relationship between y = brightness of finished paper and the independent variables x1 = hydrogen peroxide (% by weight), x2 = sodium hydroxide (% by weight), x3 = silicate (% by weight), and x4 = process temperature. † x1 x2 x3 x4 y 0.2 0.2 1.5 145 83.9 0.4 0.2 1.5 145 84.9 0.2 0.4 1.5 145 83.4 0.4 0.4 1.5 145 84.2 0.2 0.2 3.5 145 83.8 0.4 0.2 3.5 145 84.7 0.2 0.4 3.5 145 84.0 0.4 0.4 3.5 145 84.8 0.2 0.2 1.5 175 84.5 0.4 0.2 1.5 175 86.0 0.2 0.4 1.5 175 82.6 0.4 0.4 1.5 175 85.1 0.2 0.2 3.5 175 84.5 0.4 0.2 3.5 175 86.0 0.2 0.4 3.5 175 84.0 0.4 0.4 3.5 175 85.4 x1 x2 x3 x4 y 0.1 0.3 2.5 160 82.9 0.5 0.3 2.5 160 85.5 0.3 0.1 2.5 160 85.2 0.3 0.5 2.5 160 84.5 0.3 0.3 0.5 160 84.7 0.3 0.3 4.5 160 85.0 0.3 0.3 2.5 130 84.9 0.3 0.3 2.5 190 84.0 0.3 0.3 2.5 160 84.5 0.3 0.3 2.5 160 84.7 0.3 0.3 2.5 160 84.6 0.3 0.3 2.5 160…arrow_forwardAn article contained the following observations on degree of polymerization for paper specimens for which viscosity times concentration fell in a certain middle range: 416 421 422 423 426 428 430 434 437 439 446 447 449 453 456 462 464 Comment on any interesting features. (Select all that apply.) ___The data appears to be centered near 438. ___There are no outliers. ___There is little or no skew. ___There is one outlier. ___The data is strongly skewed. ___The data appears to be centered near 428 Calculate a two-sided 95% confidence interval for true average degree of polymerization. (Round your answers to two decimal places.) (____, ____)arrow_forward
arrow_back_ios
SEE MORE QUESTIONS
arrow_forward_ios
Recommended textbooks for you
 Big Ideas Math A Bridge To Success Algebra 1: Stu...AlgebraISBN:9781680331141Author:HOUGHTON MIFFLIN HARCOURTPublisher:Houghton Mifflin Harcourt
Big Ideas Math A Bridge To Success Algebra 1: Stu...
Algebra
ISBN:9781680331141
Author:HOUGHTON MIFFLIN HARCOURT
Publisher:Houghton Mifflin Harcourt
Correlation Vs Regression: Difference Between them with definition & Comparison Chart; Author: Key Differences;https://www.youtube.com/watch?v=Ou2QGSJVd0U;License: Standard YouTube License, CC-BY
Correlation and Regression: Concepts with Illustrative examples; Author: LEARN & APPLY : Lean and Six Sigma;https://www.youtube.com/watch?v=xTpHD5WLuoA;License: Standard YouTube License, CC-BY