
STAT TECH IN BUSINESS & ECON AC
18th Edition
ISBN: 9781264731657
Author: Lind
Publisher: MCG
expand_more
expand_more
format_list_bulleted
Concept explainers
Videos
Textbook Question
Chapter 3, Problem 29E
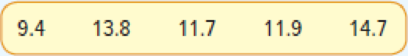
Listed below is the percent increase in sales for the MG Corporation over the last 5 years. Determine the geometric
Expert Solution & Answer
Want to see the full answer?
Check out a sample textbook solution
Students have asked these similar questions
The bar graph below shows trends in several economic indicators over the period 2003-2008.
Over the six-year period, about what was the highest consumer price index, and when did
it occur?
Consumer Price Index
ILJ
-0.5 2003 2004 2005 2006 2007 2008
To the nearest tenth of a percent, the highest consumer price index was
occurred in the year
%, and it
From 1985 to 2006 the net sales for the J.M. Smucker Company increased from $157 million to $687 million. Compute the mean annual percent increase in net sales.
The population of Ada County, Idaho has been steadily increasing for more than 20 years. The table below shows the population (people) from 2015 through 2019 in Ada County.
year
2015
2016
2017
2018
2019
population 432,862 444,486 456,548 468,764 481,587
a. What is the average rate of change in the population of Ada County from 2015 to 2018? Round to the nearest whole person and include units.
b. What is the average rate of change in the population of Ada County from 2016 to 2018? Round to the nearest whole person and include units.
c. What is the average rate of change in the population of Ada County from 2017 to 2018? Round to the nearest whole person and include units.
d. What is the average rate of change in the population of Ada County from 2018 to 2019? Round to the nearest whole person and include units.
e. Give a good approximation for the rate at which the population of Ada County is growing by the end of 2018? Round to the nearest whole person and include units.
Chapter 3 Solutions
STAT TECH IN BUSINESS & ECON AC
Ch. 3 - The annual incomes of a sample of...Ch. 3 - The six students in Computer Science 411 are a...Ch. 3 - Compute the mean of the following population...Ch. 3 - Compute the mean of the following population...Ch. 3 - a. Compute the mean of the following sample...Ch. 3 - a. Compute the mean of the following sample...Ch. 3 - Compute the mean of the following sample values:...Ch. 3 - Suppose you go to the grocery store and spend...Ch. 3 - For Exercises 710, (a) compute the arithmetic mean...Ch. 3 - For Exercises 710, (a) compute the arithmetic mean...
Ch. 3 - For Exercises 710, (a) compute the arithmetic mean...Ch. 3 - For Exercises 710, (a) compute the arithmetic mean...Ch. 3 - Prob. 11ECh. 3 - Prob. 12ECh. 3 - Prob. 2.1SRCh. 3 - Prob. 2.2SRCh. 3 - Prob. 13ECh. 3 - Prob. 14ECh. 3 - Prob. 15ECh. 3 - Prob. 16ECh. 3 - Prob. 17ECh. 3 - Prob. 18ECh. 3 - Prob. 19ECh. 3 - Prob. 20ECh. 3 - Prob. 3SRCh. 3 - Prob. 21ECh. 3 - Prob. 22ECh. 3 - Prob. 4SRCh. 3 - Prob. 23ECh. 3 - Prob. 24ECh. 3 - Prob. 25ECh. 3 - Prob. 26ECh. 3 - Prob. 5.1SRCh. 3 - Prob. 5.2SRCh. 3 - Compute the geometric mean of the following...Ch. 3 - Prob. 28ECh. 3 - Listed below is the percent increase in sales for...Ch. 3 - Prob. 30ECh. 3 - Prob. 31ECh. 3 - Prob. 32ECh. 3 - Prob. 33ECh. 3 - Prob. 34ECh. 3 - Prob. 6SRCh. 3 - Prob. 35ECh. 3 - Prob. 36ECh. 3 - Prob. 37ECh. 3 - Prob. 38ECh. 3 - Prob. 39ECh. 3 - Prob. 40ECh. 3 - Prob. 7SRCh. 3 - Prob. 41ECh. 3 - Prob. 42ECh. 3 - Prob. 43ECh. 3 - Prob. 44ECh. 3 - Plywood Inc. reported these returns on stockholder...Ch. 3 - Prob. 46ECh. 3 - Prob. 8SRCh. 3 - Prob. 47ECh. 3 - Prob. 48ECh. 3 - Prob. 49ECh. 3 - Prob. 50ECh. 3 - Prob. 51ECh. 3 - Prob. 52ECh. 3 - Prob. 9SRCh. 3 - Prob. 53ECh. 3 - The mean income of a group of sample observations...Ch. 3 - Prob. 55ECh. 3 - Prob. 56ECh. 3 - Prob. 10SRCh. 3 - Prob. 57ECh. 3 - Prob. 58ECh. 3 - Prob. 59ECh. 3 - Prob. 60ECh. 3 - The IRS was interested in the number of individual...Ch. 3 - Prob. 62ECh. 3 - Prob. 63CECh. 3 - Prob. 64CECh. 3 - Prob. 65CECh. 3 - Prob. 66CECh. 3 - Prob. 67CECh. 3 - Prob. 68CECh. 3 - Prob. 69CECh. 3 - Prob. 70CECh. 3 - Prob. 71CECh. 3 - Prob. 72CECh. 3 - Prob. 73CECh. 3 - A recent article suggested that, if you earn...Ch. 3 - Prob. 75CECh. 3 - Prob. 76CECh. 3 - Prob. 77CECh. 3 - Prob. 78CECh. 3 - The Apollo space program lasted from 1967 until...Ch. 3 - Prob. 80CECh. 3 - Prob. 81CECh. 3 - Prob. 82CECh. 3 - Prob. 83CECh. 3 - Prob. 84CECh. 3 - Bidwell Electronics Inc. recently surveyed a...Ch. 3 - Refer to the North Valley Real Estate data and...Ch. 3 - Prob. 87DACh. 3 - Refer to the Lincolnville School District bus...
Knowledge Booster


Learn more about
Need a deep-dive on the concept behind this application? Look no further. Learn more about this topic, statistics and related others by exploring similar questions and additional content below.Similar questions
- The US. import of wine (in hectoliters) for several years is given in Table 5. Determine whether the trend appearslinear. Ifso, and assuming the trend continues, in what year will imports exceed 12,000 hectoliters?arrow_forwardLimpopo company has recorded quarterly maize sales and seasonal ratios from 2015 to 2017 financial year. Table 1 shows quarterly maize production sales with their seasonal ratios (SR). Table 1: Seasonal ratios for maize production sales. Year 2015 2016 Quarter Sales SR Q₁, Q₂, Q3, Q Q₁ ₂ 8, 12, 12, 10 Q₂, Q3, 10, 15, 14, 10 111.63, 87.87 83.33,122.45, 115.42, 84.18 Q4 Use Table 1 to calculate: a) the median seasonal indices (S) and their totals (S). b) the adjusted factor. c) the adjusted seasonal indices (S) and their totals (S.). Q₁ 9 Q₂ 14 2017 " Q3, Q₁ 14, 12 76.60 ,116.67, 113.09, 94.12arrow_forwardThe Consumer Price Index is reported monthly by the U.S. Bureau of Labor Statistics. It reports the charge in prices for a market basket of goods from one period to another. The index for 2010 was 213.967. BY 2017, it increased to 239.051 What was the geometric mean annual increase for the period? ( Round your answer to 1 decimal)arrow_forward
- Define relative efficiency?arrow_forwardThe average price (in cents) per pound of sugar observed during the period September 2012 to September 2013 in most US cities is displayed in the line graph provided. What was the percentage increase in the price (in cents) per pound of sugar from November 2012 to January 2013? 18.6 Average price of sugar in US cities 17.8 17.0 16.2 15.4 14.6 13.8 13.0 Sep-12 Nov-12 Dec-12 Jan-13 Mar-13 Apr-13 Feb-13 May-13 Jun-13 Jul-13 Sep-13 Oct-12 Aug-13arrow_forwardThe following are th P/E ratios (price of stock divided by projected earnings per share) for 20 banks. 15,22,29,19,22,19,31,15,29,18,34,24,23,21,14,21,17,50,23 find the 30th and 75th percentile for these ratiosarrow_forward
- The accompanying line graph shows how the average salary for baseball players in a certain league has increased over a 12-year period. Notice the average salary is given for odd-numbered years only. Also note that the left scale does not start at zero. What was the average baseball player's salary in 2011? 5- 4.5- 4- 3.5- 3- 2.57 2007 2019 Year ..... $ million (Type a whole number or a decimal.) Average Salary ($ millions)arrow_forwardSuppose that a company's annual sales were $1,200,000 in 1999. The annual growth rate of sales from 1999 to 2000 was 16%, from 2000 to 2001 was -5%, and from 2001 to 2002 was 22%.The geometric mean growth rate of sales over this three-year period is calculated as 10.37%. Use the geometric mean growth rate and determine the forecasted sales for 2004.A. 1,780,678B. 1,200,014C. 1,965,337D. 1,613,371E. 1,422,197arrow_forwardChoose the correct optionarrow_forward
- The accompanying table gives the population (in hundred thousands) and number of people not covered by health insurance (in hundred thousands) for a certain country. Find the percentage of people not covered by health insurance for each of the given years and describe the trend. Year Uninsured Total Population 1990 35,513 251,867 2000 36,872 281,466 2015 29,470 313,513 ..... Find the percentage of people not covered by health insurance for each of the given years. Year % Uninsured 1990 % 2000 2015 % (Round to one decimal place as needed.) -....arrow_forwardThere is a drastic change in the expected age dependency ratio in the year 2060 compared to what the values were in 2010. Explain this change and explain what it means for both the working class (aged 18-64) people and the rest of the population.arrow_forwardListed are the net sales for a San Francisco–area mail-order retailer for the years 2009 to 2018. Use the mean sales for the earliest three years to determine a base and then find the index for 2017 and 2018. (Round your answers to 1 decimal place.) By how much have net sales increased from the base period? (Round your answers to 1 decimal place.)arrow_forward
arrow_back_ios
SEE MORE QUESTIONS
arrow_forward_ios
Recommended textbooks for you
 Glencoe Algebra 1, Student Edition, 9780079039897...AlgebraISBN:9780079039897Author:CarterPublisher:McGraw Hill
 College Algebra (MindTap Course List)AlgebraISBN:9781305652231Author:R. David Gustafson, Jeff HughesPublisher:Cengage Learning
 College AlgebraAlgebraISBN:9781305115545Author:James Stewart, Lothar Redlin, Saleem WatsonPublisher:Cengage Learning
 Holt Mcdougal Larson Pre-algebra: Student Edition...AlgebraISBN:9780547587776Author:HOLT MCDOUGALPublisher:HOLT MCDOUGAL
Glencoe Algebra 1, Student Edition, 9780079039897...
Algebra
ISBN:9780079039897
Author:Carter
Publisher:McGraw Hill
College Algebra (MindTap Course List)
Algebra
ISBN:9781305652231
Author:R. David Gustafson, Jeff Hughes
Publisher:Cengage Learning
College Algebra
Algebra
ISBN:9781305115545
Author:James Stewart, Lothar Redlin, Saleem Watson
Publisher:Cengage Learning
Holt Mcdougal Larson Pre-algebra: Student Edition...
Algebra
ISBN:9780547587776
Author:HOLT MCDOUGAL
Publisher:HOLT MCDOUGAL
The Shape of Data: Distributions: Crash Course Statistics #7; Author: CrashCourse;https://www.youtube.com/watch?v=bPFNxD3Yg6U;License: Standard YouTube License, CC-BY
Shape, Center, and Spread - Module 20.2 (Part 1); Author: Mrmathblog;https://www.youtube.com/watch?v=COaid7O_Gag;License: Standard YouTube License, CC-BY
Shape, Center and Spread; Author: Emily Murdock;https://www.youtube.com/watch?v=_YyW0DSCzpM;License: Standard Youtube License