
Concept explainers
Videos
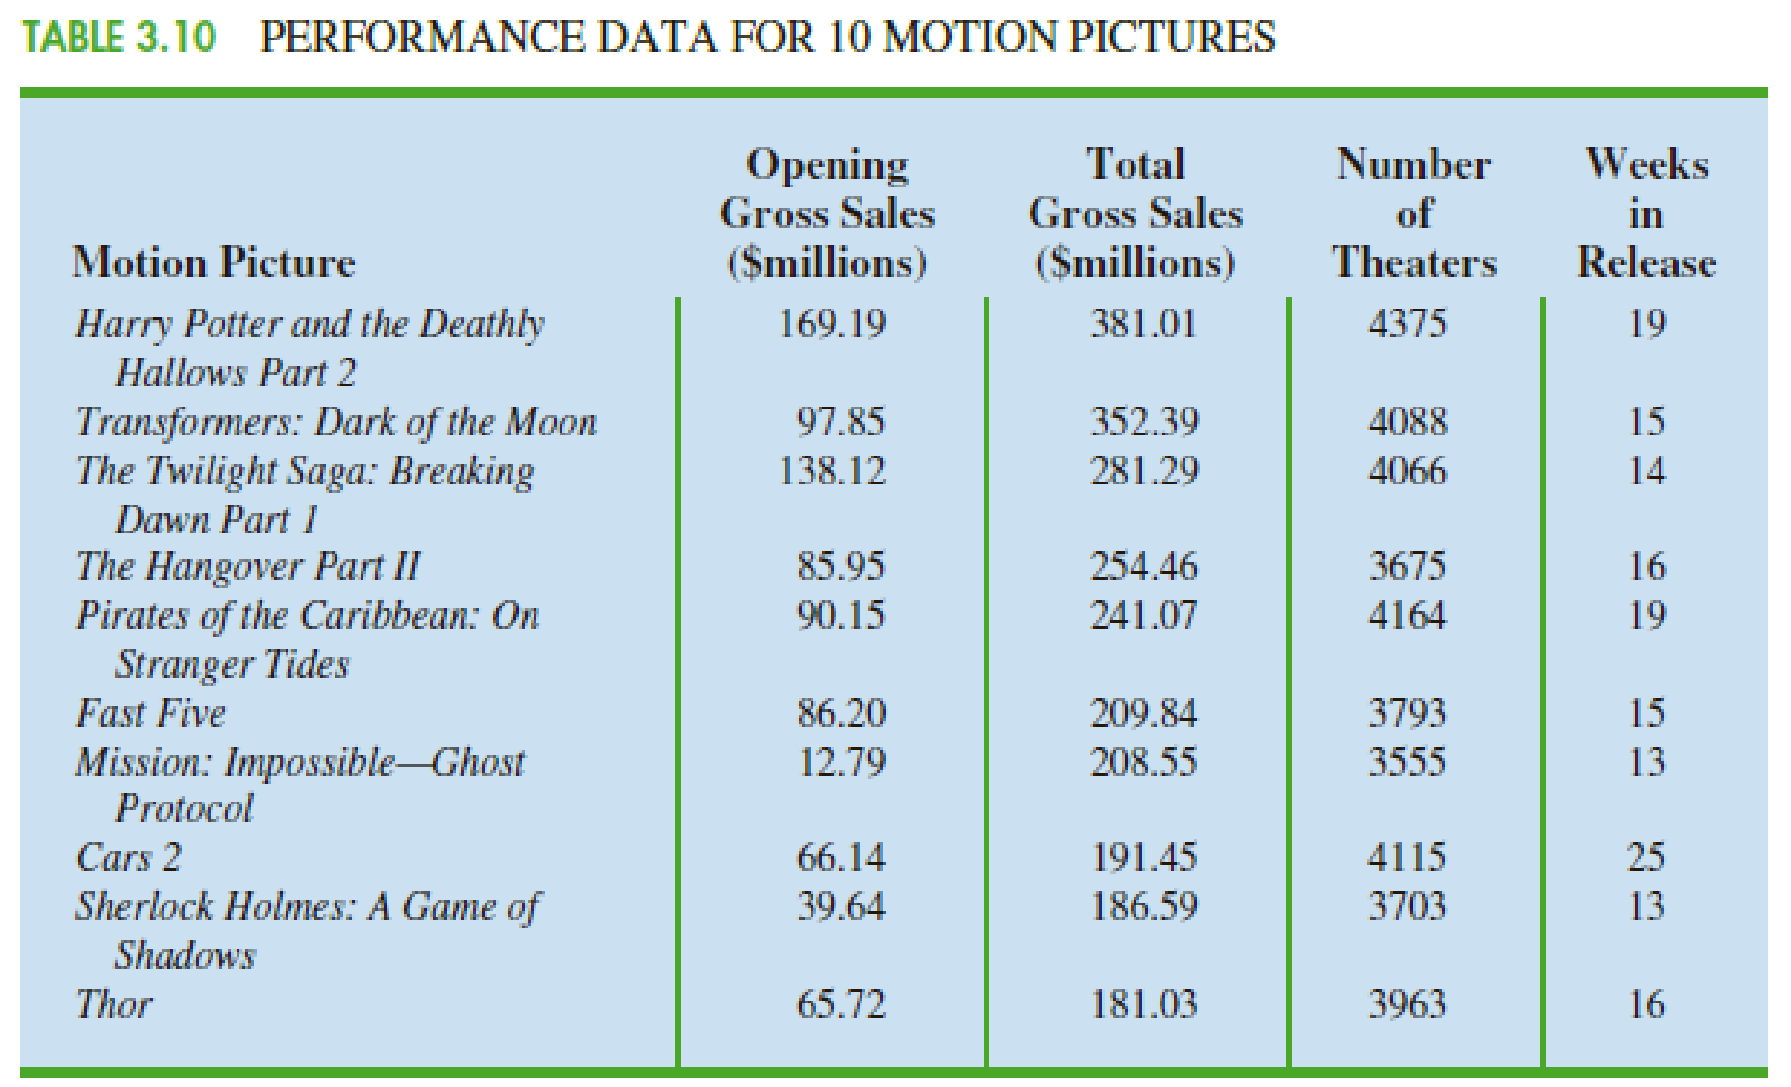
The motion picture industry is a competitive business. More than 50 studios produce several hundred new motion pictures each year, and the financial success of the motion pictures varies considerably. The opening weekend gross sales, the total gross sales, the number of theaters the movie was shown in, and the number of weeks the motion picture was in release are common variables used to measure the success of a motion picture. Data on the top 100 grossing motion pictures released in 2011 (Box Office Mojo website, March 17, 2012) are contained in a file named 2011Movies. Table 3.10 shows the data for the first 10 motion pictures in this file. Note that some movies, such as War Horse, were released late in 2011 and continued to run in 2012.
Managerial Report
Use the numerical methods of
1. Descriptive statistics for each of the four variables along with a discussion of what the descriptive statistics tell us about the motion picture industry.
2. What motion pictures, if any, should be considered high-performance outliers? Explain.
3. Descriptive statistics showing the relationship between total gross sales and each of the other variables. Discuss.
Want to see the full answer?
Check out a sample textbook solution
Chapter 3 Solutions
MindTap Business Statistics, 1 term (6 months) Printed Access Card for Anderson/Sweeney/Williams/Camm/Cochran's Essentials of Statistics for Business and Economics, 8th


- An auto parts store operated 3549 stores in 2004. By 2007, the auto parts store operated 4140 stores. Assuming the number of stores followed a linear pattern, how many stores would they have operated in 2010?arrow_forwardA medical researcher wishes to describe the relationship between the prescription cost of a brand name drug and its generic equivalent. Is the linear relationship between brand name drug cost and generic drug cost negative? a. yes b. no c. cannot be determinedarrow_forwardCite and briefly describe scenarios where dependent and independent variables are employed.arrow_forward
- which is linear and non-linear?arrow_forwardMaggie's Bakery bakes several batches of double fudge brownies each week. The table shows the relationship between the batches of brownies, b, and the cups of flour, c.Which equation models the relationship between the independent and dependent variables? Responses A c = 4b c = 4b B c = 4 + b c = 4 + b C b = 4 + c b = 4 + c D b = 4carrow_forwardDo you observe a linear relationship between the two variables?arrow_forward
- What does it mean to say two variables are positively associated? When the value of one variable increases, the value of the other variable also increases. There is a nonlinear relationship between the variables. When the value of one variable increases, the value of the other variable decreases. There is a linear relationship between the variables.arrow_forwardAccording to a study, 50,000 bachelor degrees in business were awarded in 1990 and 100,000 were awarded in 2000. If the number of bachelor degrees in business continues to grow linearly, a) Identify what x and y are and find the linear equation that models this information. b) How many bachelor degrees in business will be awarded in 2022?arrow_forwardSuppose that two variables, say x and y, have a very strong negative linear relationship. By virtue of the fact that the relationship is a STRONG, NEGATIVE, LINEAR relationship, which of the following statements is (are) true? Select ALL that apply. A. If the value of x increases, then we expect the value of y to decrease. B. If the value of x decreases, then we expect the value of y to decrease as well. C. If the value of x decreases, then we expect the value of y to increase. D. If the value of x increases, then we expect the value of y to increase as well.arrow_forward
- Do you observe a linear relationship between the two variables; consider R2?arrow_forwardSuppose that two variables, say x and y, have a very strong positive linear relationship. By virtue of the fact that the relationship is a STRONG, POSITIVE, LINEAR relationship, which of the following statements is (are) true? Select ALL that apply. A. If the value of x decreases, then we expect the value of y to decrease as well. B. If the value of x decreases, then we expect the value of y to increase. C. If the value of x increases, then we expect the value of y to increase as well. D. If the value of x increases, then we expect the value of y to decrease.arrow_forwardwhich is linear and non-linear? easyarrow_forward
 Algebra: Structure And Method, Book 1AlgebraISBN:9780395977224Author:Richard G. Brown, Mary P. Dolciani, Robert H. Sorgenfrey, William L. ColePublisher:McDougal Littell
 Algebra & Trigonometry with Analytic GeometryAlgebraISBN:9781133382119Author:SwokowskiPublisher:Cengage
 Glencoe Algebra 1, Student Edition, 9780079039897...AlgebraISBN:9780079039897Author:CarterPublisher:McGraw Hill