
Concept explainers
Videos
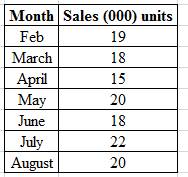
National Scan, Inc., sells radio frequency inventory tags. Monthly sales for a seven-month period were as follows:
| Month | Sales (000 units) |
| Feb. | 19 |
| Mar. | 18 |
| Apr. | 15 |
| May | 20 |
| Jun. | 18 |
| Jul. | 22 |
| Aug. | 20 |
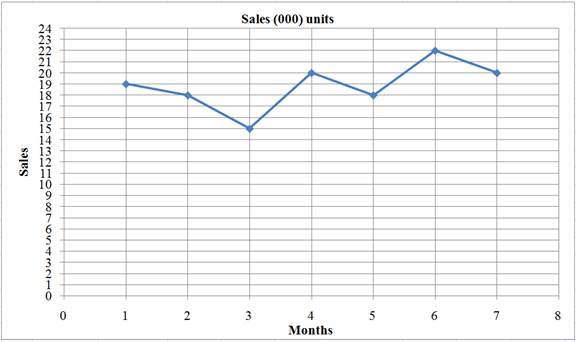
a. Plot the monthly data on a sheet of graph paper.
b.
(1) The naive approach
(2) A five month moving average
(3) A weighted average using .60 for August, .30 for July, and .10 for June
(4) Exponential smoothing with a smoothing constant equal to .20, assuming a a March forecast of 19(000)
(5) A linear trend equation
c. Which method seems least appropriate Why? (Hint: Refer to your plot from part a.)
d. What does use of the term sales rather than demand presume?
a)
To plot: The monthly data on a sheet of graph paper.
Introduction: Forecasting is the planning process that helps to predict the future aspects of the business or operation using present or past data. It uses certain assumptions based the knowledge and experience of the management.
Explanation of Solution
Given information:
The monthly sales data of RF tags for a seven-month period is given as shown below:
Plot the monthly data on a graph with Sales on the Y axis and months on the X-axis as shown below:
b)
To determine: The forecast for September sales using the following approaches.
Introduction: Forecasting is the planning process that helps to predict the future aspects of the business or operation using present or past data. It uses certain assumptions based the knowledge and experience of the management.
Explanation of Solution
- 1) Forecast the September sales using the naïve approach as shown below:
The forecast for the month of September as per the naïve approach, will be the same as the sales for the month of August, which is 20,000 units of sales.
- 2) Calculate the forecast for the month of September using a five-month period moving average as shown below:
Substitute in the above equation the values of
- 3) Calculate the forecast for September using the weighted average method, where the weights are 0.60 for August, 0.30 for July and 0.10 for June as shown below:
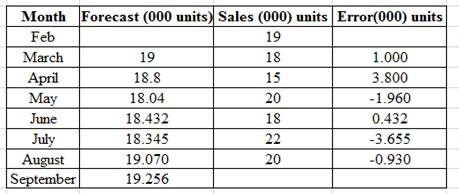
- 4) To compute the forecast using an exponential smoothing constant α equal to 0.20 and assuming a March forecast of 19,000 units, first calculate the forecasts for the months of March, April, May, June, July and August as shown below:
Given that the March actual was 18,000 units and the forecast was 19,000 units, the error in the forecast was 1,000 units. Therefore, the forecast for the month of April would be as follows:
Given that the April actual was 15,000 units and the forecast was 18,800 units, the error in the April forecast was 3,800 units. Therefore, the forecast for the month of May would be as follows:
Given that the May actual was 20,000 units and the forecast was 18,040 units, the error in the May forecast was 1,960 units. Therefore, the forecast for the month of June would be as follows:
Given that the June actual was 18,000 units and the forecast was 18,432 units, the error in the June forecast was 432 units. Therefore, the forecast for the month of July would be as follows:
Given that the July actual was 22,000 units and the forecast was 18,345 units, the error in the July forecast was 3,655 units. Therefore, the forecast for the month of August would be as follows:
Given that the August actual was 20,000 units and the forecast was 19,070 units, the error in the August forecast was 930 units. Therefore, the forecast for the month of September would be as follows:
Therefore, the forecast for the month of September using exponential smoothing would be 19,256 units.
Summarize the above calculations in a table as shown below:
5) Calculate the forecast for September using linear trend equation:
A linear trend equation for the monthly sales using Microsoft Excelis graphically shown below:
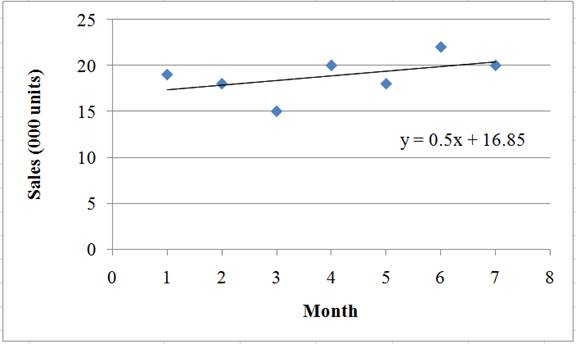
Substitute the value of
The forecast sales in September works out to be 20,857 units.
c)
To determine: The method which seems to least appropriate.
Introduction: Forecasting is the planning process that helps to predict the future aspects of the business or operation using present or past data. It uses certain assumptions based the knowledge and experience of the management.
Explanation of Solution
Among the five approaches calculated above, the linear trend approach seems to be the least appropriate. The equation
d)
To determine: The use of the term sales rather than demand presume.
Introduction: Forecasting is the planning process that helps to predict the future aspects of the business or operation using present or past data. It uses certain assumptions based the knowledge and experience of the management.
Explanation of Solution
When the term sales is used for demand, it is presumed that there are no stock-outs. In other words, in every month the sales were the same as demand figures.
Want to see more full solutions like this?
Chapter 3 Solutions
Operations Management (McGraw-Hill Series in Operations and Decision Sciences)
Additional Business Textbook Solutions
Principles of Operations Management: Sustainability and Supply Chain Management (10th Edition)
Business in Action (8th Edition)
Operations Management, Binder Ready Version: An Integrated Approach
Operations Management: Processes and Supply Chains (12th Edition) (What's New in Operations Management)
Principles Of Operations Management
Operations Management: Sustainability and Supply Chain Management (12th Edition)


- Under what conditions might a firm use multiple forecasting methods?arrow_forwardHandy, Inc., produces a solar-powered electronic calculator that has experiencedthe following monthly sales history for the first four months of the year, inthousands of units:January 23.3 March 30.3February 72.3 April 15.5a. If the forecast for January was 25, determine the one-step-ahead forecasts forFebruary through May using exponential smoothing with a smoothing constant of a=.15.b. Repeat the calculation in part (a) for a value of a= .40. What difference in theforecasts do you observe?c. Compute the MSEs for the forecasts you obtained in parts (a) and (b) forFebruary through April. Which value of a gave more accurate forecasts, basedon the MSE?arrow_forwardplease answer in excel Jean’s Copiers sells and repairs photocopy machines. The manager needs weekly forecasts of service calls so that she can schedule the personnel. The manager uses α = 0.3 for exponential smoothing, and the forecast for the first week was 24 calls. The manager also uses 3 weekly moving averages technique. a) Using 3 period moving averages, forecast the number of calls for week 7. b) Using exponential smoothing, forecast the number of calls for week 7. c) Compare these two forecasting techniques using Mean Squared Errors (MSE) measure. Which one is better?arrow_forward
- National Scan, Inc., sells radio frequency inventory tags. Monthly sales for a seven-month period were as follows: Month Sales (000 units)Feb. 19Mar. 18Apr. 15May 20Jun. 18Jul. 22Aug. 20 Forecast September sales volume using each of the following: (1)The naive approach. (2)A five-month moving average. (3)A weighted average using .60 for August, .30 for July, and .10 for June.arrow_forward3. A large Portland manufacturing would like to forecast the monthly demand for a piece of pollutioncontrol equipment. Suppose the monthly sales figures for the past five months have been as follows:Month 1 2 3 4 5Actual Demand 14 17 20 21 25a. Make a forecast for 6th month using a three-period moving average (MA). What would be the forecastfor 6th month?b. The manager would like to use simple exponential smoothing to forecast. Use alpha = 0.25. Whatwould be the forecast for 6th month?c. Find the better forecast out of Moving Average and Simple Exponential Smoothingarrow_forwardDescribe the use of forecasting in compiling a technical document?arrow_forward
- 17. Statistical and observational methods, where adequate data or settings are available in which to apply them, are superior to survey methods of forecasting. Select one O True O Falsearrow_forwardDaily demand for newspapers for the last 10 days has been as follows: 12, 13, 16, 15, 12, 18, 14, 12, 13,15 (listed from oldest to most recent). Forecast sales for the next day using a three-day weighted moving average where the weights are 3, 1, and 1 (the highest weight is for the most recent number). Sample paper answers: 1) None of the provided options.2) 13.03) 12.84) 70.014.0arrow_forwardWeek Sales1 27502 31003 32504 28005 29006 30507 33008 31009 295010 300011 320012 3150Develop a three-week moving average. A.What is the forecast for week 5? (Make sure no decimal place and no comma. EX: 1234) B.What is the value of MSE (mean squared error) with regard to a three-week moving average? (Make sure no decimal place and no comma. EX: 1234) C.Develop the exponential smoothing with the alpha value of 0.20. What is the forecast for week 5? (Make sure no decimal place and no comma. EX: 1234) D.What is the value of MSE (mean squared error) with regard to the exponential smoothing? (Make sure no decimal place and no comma. EX: 1234) E.Which method is more accurate? (1 for Moving average, 2 for Exponential Smoothing)arrow_forward
- 6) 4 Consider the following time series data. Month 1 2 3 4 5 6 7 Value 24 13 20 12 19 23 15 i) Construct a time series plot. What type of pattern exist in the data? ii)Develop a three – week moving average for the time series. Compute MSE and a forecast cast for week 8. iii)Use alpha = 0.2 to compute the exponential smoothing value for the time series. Compute MSE and a forecast for week 8. iv)Compare the three -week moving average forecast with exponential smoothing forecast using alpha = 0.2. Which appears to provide the better forecast based on MSE? Explain v)Use trial and error to find a value of the exponential smoothing. Coefficient Alpha that result in a smaller MSE than what you calculated for alpha = 0.2.arrow_forwardIndicate how and why each of these factors is important to thesuccessful operation of a supermarket:b. Forecastingarrow_forward41) A medium-term forecast is considered to cover what length of time? A) 2-4 weeks B) 1 month to 1 year C) 2-4 years D) 5-10 years E) 20 years 42) When is the exponential smoothing model equivalent to the naïve forecasting model? A) ? = 0 B) ? = 0.5 C) ? = 1 D) during the first period in which it is used E) never 43) Enrollment in a particular class for the last four semesters has been 120, 126, 110, and 130. Suppose a one-semester moving average was used to forecast enrollment (this is sometimes referred to as a naïve forecast). Thus, the forecast for the second semester would be 120, for the third semester it would be 126, and for the last semester it would be 110. What would the MSE be for this situation? A) 196.00 B) 230.67 C) 100.00 D) 42.00 E) None of the above 44) Which of the following methods tells whether the forecast tends to be too high or too low? A) MAD B) MSE C) MAPE D) decomposition E) bias 45) Assume that you have tried three different…arrow_forward
 Contemporary MarketingMarketingISBN:9780357033777Author:Louis E. Boone, David L. KurtzPublisher:Cengage Learning
 MarketingMarketingISBN:9780357033791Author:Pride, William MPublisher:South Western Educational Publishing