
EBK BUSINESS ANALYTICS
3rd Edition
ISBN: 9780135231906
Author: Evans
Publisher: VST
expand_more
expand_more
format_list_bulleted
Question
Chapter 3, Problem 2PE
To determine
To create a line chart showing the growth in the annual CPI.
Expert Solution & Answer
Explanation of Solution
Given:
The Consumer price index excel file data is as follows:
| Consumer Price Index - All Urban Consumers | Bureau of Labor Statistics | |||||||||||
| Year | Jan | Feb | Mar | Apr | May | Jun | Jul | Aug | Sep | Oct | Nov | Dec |
| 2000 | 169.300 | 170.000 | 171.000 | 170.900 | 171.200 | 172.200 | 172.700 | 172.700 | 173.600 | 173.900 | 174.200 | 174.600 |
| 2001 | 175.600 | 176.000 | 176.100 | 176.400 | 177.300 | 177.700 | 177.400 | 177.400 | 178.100 | 177.600 | 177.500 | 177.400 |
| 2002 | 177.700 | 178.000 | 178.500 | 179.300 | 179.500 | 179.600 | 180.000 | 180.500 | 180.800 | 181.200 | 181.500 | 181.800 |
| 2003 | 182.600 | 183.600 | 183.900 | 183.200 | 182.900 | 183.100 | 183.700 | 184.500 | 185.100 | 184.900 | 185.000 | 185.500 |
| 2004 | 186.300 | 186.700 | 187.100 | 187.400 | 188.200 | 188.900 | 189.100 | 189.200 | 189.800 | 190.800 | 191.700 | 191.700 |
| 2005 | 191.600 | 192.400 | 193.100 | 193.700 | 193.600 | 193.700 | 194.900 | 196.1000 | 198.800 | 199.100 | 198.100 | 198.100 |
| 2006 | 199.200 | 199.400 | 199.700 | 200.600 | 201.400 | 201.900 | 202.900 | 203.700 | 202.900 | 201.800 | 202.000 | 203.100 |
| 2007 | 203.372 | 204.258 | 205.312 | 205.959 | 206.850 | 207.202 | 207.651 | 207.671 | 208.503 | 209.073 | 210.740 | 211.434 |
| 2008 | 212.225 | 212.703 | 213.543 | 214.106 | 215.287 | 217.279 | 219.102 | 218.779 | 218.846 | 216.832 | 212.923 | 211.339 |
| 2009 | 211.959 | 212.877 | 212.643 | 212.810 | 213.050 | 214.558 | 214.774 | 215.566 | 215.911 | 216.357 | 216.859 | 217.224 |
| 2010 | 217.587 | 217.591 | 217.729 | 217.579 | 217.224 | 216.929 | 217.597 | 218.150 | ||||
Calculation:
Since, we have to show the line chart for the growth in annual CPI. Thus, we have to take the sum of the months yearly basis. We will use the formula for sum, such as,
=SUM(number1,[number2],...])
Thus the result will be as:
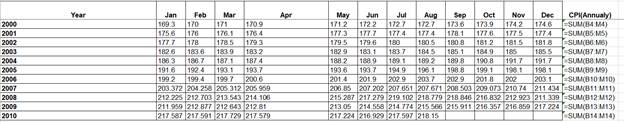
And the outcome will be:
| Year | Jan | Feb | Mar | Apr | May | Jun | Jul | Aug | Sep | Oct | Nov | Dec | CPI(Annualy) |
| 2000 | 169.300 | 170.000 | 171.000 | 170.900 | 171.200 | 172.200 | 172.700 | 172.700 | 173.600 | 173.900 | 174.200 | 174.600 | 2066.300 |
| 2001 | 175.600 | 176.000 | 176.100 | 176.400 | 177.300 | 177.700 | 177.400 | 177.400 | 178.100 | 177.600 | 177.500 | 177.400 | 2124.500 |
| 2002 | 177.700 | 178.000 | 178.500 | 179.300 | 179.500 | 179.600 | 180.000 | 180.500 | 180.800 | 181.200 | 181.500 | 181.800 | 2158.400 |
| 2003 | 182.600 | 183.600 | 183.900 | 183.200 | 182.900 | 183.100 | 183.700 | 184.500 | 185.100 | 184.900 | 185.000 | 185.500 | 2208.000 |
| 2004 | 186.300 | 186.700 | 187.100 | 187.400 | 188.200 | 188.900 | 189.100 | 189.200 | 189.800 | 190.800 | 191.700 | 191.700 | 2266.900 |
| 2005 | 191.600 | 192.400 | 193.100 | 193.700 | 193.600 | 193.700 | 194.900 | 196.1000 | 198.800 | 199.100 | 198.100 | 198.100 | 2343.200 |
| 2006 | 199.200 | 199.400 | 199.700 | 200.600 | 201.400 | 201.900 | 202.900 | 203.700 | 202.900 | 201.800 | 202.000 | 203.100 | 2418.600 |
| 2007 | 203.372 | 204.258 | 205.312 | 205.959 | 206.850 | 207.202 | 207.651 | 207.671 | 208.503 | 209.073 | 210.740 | 211.434 | 2488.025 |
| 2008 | 212.225 | 212.703 | 213.543 | 214.106 | 215.287 | 217.279 | 219.102 | 218.779 | 218.846 | 216.832 | 212.923 | 211.339 | 2582.964 |
| 2009 | 211.959 | 212.877 | 212.643 | 212.810 | 213.050 | 214.558 | 214.774 | 215.566 | 215.911 | 216.357 | 216.859 | 217.224 | 2574.588 |
| 2010 | 217.587 | 217.591 | 217.729 | 217.579 | 217.224 | 216.929 | 217.597 | 218.150 | 1740.386 |
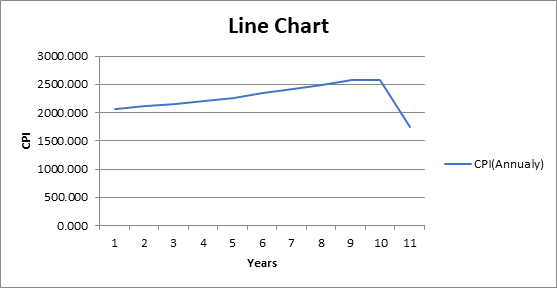
Then, we will construct the line chart by selecting the last column of CPI (annually) of the sums of the months year wise and then go to the insert button and then click on the line chart and the line chart is created,
The line chart is as follows:
Want to see more full solutions like this?
Subscribe now to access step-by-step solutions to millions of textbook problems written by subject matter experts!
Students have asked these similar questions
Cell phone sales for a California-based firm over the last 10 weeks are shown in the following table. Plot the data, and visually check to see if a linear trend line would be appropriate.Then determine the equation of the trend line, and predict sales for weeks 11 and 12.Week Unit Sales1 7002 7243 7204 7285 7406 7427 7588 7509 77010 775
The table below shows the sales for a plastics manufacturer recorded over the past
year. The seasonal indexes for each quarter are also provided). To track the trend for
these four quarters, use the indexes to deseasonalize the sales data.
Quarter
1
Sales
738
Index
75.0
Deseasonalized Sales
234
1012
104.0
1196
121.0
962
100.0
What are deseasonalized sales for quarter 2?
973.1
1052.5
1291.5
1012.0
1027.7
List the elements of a good forecast
Chapter 3 Solutions
EBK BUSINESS ANALYTICS
Ch. 3 - Prob. 2PECh. 3 - Create a line chart for the closing prices for all...Ch. 3 - Create a pie chart showing the breakdown of...Ch. 3 - Create a stacked area chart contrasting primary...Ch. 3 - A national homebuilder builds single-family homes...Ch. 3 - The Excel file Facebook Survey provides data...Ch. 3 - Create a bubble chart for the first five colleges...Ch. 3 - Construct a column chart for the data in the Excel...Ch. 3 - The Excel file Internet Usage provides data about...Ch. 3 - Construct an appropriate chart to show the...
Ch. 3 - A marketing researcher surveyed 92 individuals,...Ch. 3 - In the Excel file Banking Data, apply the...Ch. 3 - Apply three different colors of data bars to...Ch. 3 - For the Store and Regional Sales database, apply a...Ch. 3 - For the Excel file Closing Stock Prices, apply...Ch. 3 - Create a useful dashboard for the data in the...Ch. 3 - Create a useful dashboard for the data in the...Ch. 3 - Create a useful dashboard for the data in the...
Knowledge Booster

Similar questions
- The file P13_22.xlsx contains total monthly U.S. retail sales data. While holding out the final six months of observations for validation purposes, use the method of moving averages with a carefully chosen span to forecast U.S. retail sales in the next year. Comment on the performance of your model. What makes this time series more challenging to forecast?arrow_forwardYear Season Sales 2018 Winter 40 2018 Spring 29 2018 Summer 31 2018 Fall 40 2019 Winter 102 2019 Spring 87 2019 Summer 96 2019 Fall 132 2020 Winter 105 2020 Spring 93 2020 Summer 105 2020 Fall 117 2021 Winter 141 2021 Spring 39 2021 Summer 114 2021 Fall 123 What is the slope of the trend equation obtained by linear regression? Round to two decimal digits. What is the intercept of the trend equation obtained by linear regression? Round to two decimal digits. What is the seasonal index for Spring? Round to two decimal digits. The quarter number for Winter of 2018 is 1. What is the quarter number for Spring of 2025? What is the trend based forecast for Spring of 2025. Round to a whole number. What is the seasonally adjusted trend based forecast for Spring of 2025? Please do not use excel to find the slope and intercept, thank you so much!arrow_forwardB. The following table shows the number of televisions sold over the last ten years at a local electronic store. year TV sales 1 150 2 300 3 480 4 600 5 630 6 640 7 700 8 825 9 900 10 980 i. Using the trend projection, develop a formula to predict sales for years 11 and 12. Develop a table to calculate the slope and intercept. Please Show All Working. Use that formula to forecast television sales for years 11 and 12arrow_forward
- Please answer parts i, ii and iii of the below question. The table below shows the sales figures for a brand of shoe over the last 12 months. Months Sales January 69 February 75 March 86 April 92 May 95 June 100 July 108 August 115 September 125 October 131 November 140 December 150 Using the following, forecast the sales for the months up to January the following year:- i) A simple three month moving average. ii) A three period weighted moving average using weights of 1, 2 and 3. Assign the highest weight to the most recent data. iii) Exponential Smoothing when α= .6 and the forecast for March is 350.arrow_forwardThe following table shows the past two years of quarterly sales information. Assume that there are both trend and seasonal factors and that the seasonal cycle is one year. QUARTER SALES 1 215 2 240 3 205 4 190 5 160 6 195 7 150 8 140 Use regression and seasonal indexes to forecast quarterly sales for the next year. Note: Do not round intermediate calculations. Round your answers to 1 decimal place.arrow_forwardThe following table shows the past two years of quarterly sales information. Assume that there are both trend and seasonal factors and that the seasonal cycle is one year. QUARTER SALES 154 190 154 145 216 236 208 175 Use time series decomposition to forecast quarterly sales for the next year. (Do not round intermediate calculations. Round your answers to the nearest whole number.) Quarter Forecest 19 10 11 12arrow_forward
- As a Sales Head for a consumer durable firm, you wish to have sales forecast trends based on past sales rendered. Briefly describe the methods of forecasting future demand on the basis of past sales.arrow_forwardIn market survey, the present buying behavior and future purchasing plans of existing and potential customers are used to forecast demand. True Falsearrow_forwardConsider the monthly sales data of a company for last year as well as first six month data for current year. Use a three- quarter weighted moving average, Forecast the sales of company for 3rd Quarter of current year. Use Weights of 4/7, 2/7 and 1/7, giving more weight to more recent data. Note, the 1ist quarter is Jan, Feb and March , 2nd quarter is Apr, May, June, 3rd quarter is July, Aug and Sept, and 4th quarter is Oct, Nov and Dec. Month Jan Feb Mar April May June July Aug Sept Oct Nov DecLast Year 100 125 135 175 185 200 150 140 130 200 225 250Current Year 125 135 135 190 200 190arrow_forward
- Demand forecasting helps a company to respond quickly to market changesgiving the firm a competitive advantage. The process of forecasting establishesthe link between planning and control for the company, and facilitates theeffective output of the firm’s goods and services. A common quantitativemethod of forecasting is time series. Explain what is involved in time seriesanalysis and its significance to demand forecasting.arrow_forwardFrom the following annual data of sales (in 000 .$.) Find the trend values by using least square method. Also estimate the sales of 2014. Year 2004 2005 2006 2007 2008 2009 2010 Sales {In 000 $} 77 88 94 85 91 98 90arrow_forwardFind the five-month moving average of the sales of soaps for this year.arrow_forward
arrow_back_ios
SEE MORE QUESTIONS
arrow_forward_ios
Recommended textbooks for you
 Contemporary MarketingMarketingISBN:9780357033777Author:Louis E. Boone, David L. KurtzPublisher:Cengage Learning
 Practical Management ScienceOperations ManagementISBN:9781337406659Author:WINSTON, Wayne L.Publisher:Cengage,
Contemporary Marketing
Marketing
ISBN:9780357033777
Author:Louis E. Boone, David L. Kurtz
Publisher:Cengage Learning
Practical Management Science
Operations Management
ISBN:9781337406659
Author:WINSTON, Wayne L.
Publisher:Cengage,