
Gitman: Principl Manageri Finance_15 (15th Edition) (What's New in Finance)
15th Edition
ISBN: 9780134476315
Author: Chad J. Zutter, Scott B. Smart
Publisher: PEARSON
expand_more
expand_more
format_list_bulleted
Videos
Textbook Question
Chapter 3, Problem 3.11P
Learning Goal 3
P3-11 Liquidity management Bauman Company’ total current assets, total current liabilities, and inventory for each of the past 4 years follow:
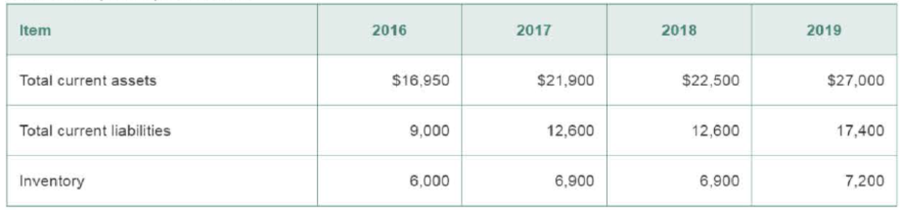
- a. Calculate the firm’s current and quick ratios for each year. Compare the resulting time series for these measures of liquidity.
- b. Comment on the firm's liquidity over the 2016- 2017 period.
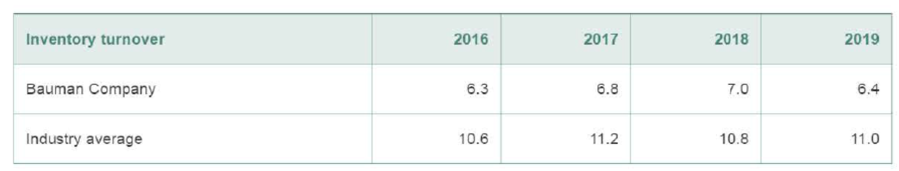
- c. If you were told that Bauman Company’s inventory turnover for each year in the 2016-2019 period and the industry averages were as follows, would this information support or conflict with your evaluation in part b? Why?
Expert Solution & Answer
Want to see the full answer?
Check out a sample textbook solution
Students have asked these similar questions
(Learning Objective 7: Calculate return on assets) Handley Grocery Corporationreported the following information in its comparative financial statements for the fiscal yearended January 31, 2018:January 31,2018January 31,2017Net sales....................................Net earnings..............................Average total assets...................$50,000$ 2,200$40,000$48,350$ 2,100$39,300Requirements1. Compute the net profit margin ratio for the years ended January 31, 2018, and 2017. Did itimprove or worsen in 2018?2. Compute asset turnover for the years ended January 31, 2018, and 2017. Did it improve orworsen in 2018?3. Compute return on assets for the years ended January 31, 2018, and 2017. Did it improveor worsen in 2018? Which component—net profit margin ratio or asset turnover—wasmostly responsible for the change in the company’s return on assets?
(Learning Objective 2: Analyze accounts payable turnover) Barnacle Sales, Inc.’s,comparative income statements and balance sheets show the following selected information for2017 and 2018:2018$2,850,000$ 800,000$ 600,000$ 305,0002017$2,700,000$ 600,000$ 400,000$ 255,000Cost of goods sold.......................................................Ending inventory.........................................................Beginning inventory ....................................................Average accounts payable ...........................................Requirements1. Calculate the company’s accounts payable turnover and days’ payable outstanding (DPO)for 2017 and 2018.2. On the basis of this computation alone, has the company’s liquidity position improved ordeteriorated during 2018?
E3-39B. (Learning Objective 6: Analyze and evaluate liquidity and debt-paying ability) BurnesConsulting Company reported these ratios at December 31, 2018 (dollar amounts in millions):Current ratio = $20 = 2.00 $10 $60 Debt ratio = = 0.50 $30Burnes Consulting completed these transactions during 2019:a. Purchased equipment on account, $4b. Paid long-term debt, $7c. Collected cash from customers in advance, $5d. Accrued interest expense, $6e. Made cash sales, $8Determine whether each transaction improved or hurt the company’s current ratio and debt ratio.
Chapter 3 Solutions
Gitman: Principl Manageri Finance_15 (15th Edition) (What's New in Finance)
Ch. 3.1 - Prob. 3.1RQCh. 3.1 - Describe the purpose of each of the four major...Ch. 3.1 - Prob. 3.3RQCh. 3.1 - Prob. 3.4RQCh. 3.2 - With regard to financial ratio analysis, how do...Ch. 3.2 - What is the difference between cross-sectional and...Ch. 3.2 - Prob. 3.7RQCh. 3.2 - Prob. 3.8RQCh. 3.3 - Under what circumstances would the current ratio...Ch. 3.3 - In Table 3.5, most of the specific firms listed...
Ch. 3.4 - To assess the firms average collection period and...Ch. 3.5 - What is financial leverage?Ch. 3.5 - What ratio measures the firms degree of...Ch. 3.6 - What three ratios of profitability appear on a...Ch. 3.6 - Prob. 3.15RQCh. 3.6 - Prob. 3.16RQCh. 3.7 - What do the price/earnings (P/E) ratio and the...Ch. 3.8 - Financial ratio analysis is often divided into...Ch. 3.8 - Prob. 3.19RQCh. 3.8 - What three areas of analysis are combined in the...Ch. 3 - For the quarter ended January 28, 2017, Kroger...Ch. 3 - Learning Goals 3, 4, 5 ST3-1 Ratio formulas and...Ch. 3 - Prob. 3.2STPCh. 3 - Prob. 3.1WUECh. 3 - Learning Goal 1 E3-2 Explain why the income...Ch. 3 - Prob. 3.3WUECh. 3 - Learning Goal 3 E3-4 Bluestone Metals Inc. is a...Ch. 3 - Learning Goal 6 E3-5 If we know that a firm has a...Ch. 3 - Financial statement account identification Mark...Ch. 3 - Learning Goal 1 P3-2 1ncome statement preparation...Ch. 3 - Prob. 3.3PCh. 3 - Learning Goal 1 P3-4 Calculation of EPS and...Ch. 3 - Prob. 3.5PCh. 3 - Prob. 3.6PCh. 3 - Learning Goals 1 P3-7 Initial sale price of common...Ch. 3 - Prob. 3.8PCh. 3 - Learning Goal 1 P3-9 Changes In stockholders...Ch. 3 - Learning Goals 2, 3, 4, 5 P3-10 Ratio comparisons...Ch. 3 - Learning Goal 3 P3-11 Liquidity management Bauman...Ch. 3 - Prob. 3.12PCh. 3 - Inventory management Three companies that compete...Ch. 3 - Accounts receivable management The table below...Ch. 3 - Prob. 3.15PCh. 3 - Learning Goal 4 P3-16 Debt analysis Springfield...Ch. 3 - Prob. 3.17PCh. 3 - Learning Goals 2, 3, 4 P3-18 Using Tables 3.1,...Ch. 3 - Learning Goals 5 P3-19 Common-size statement...Ch. 3 - The relationship between financial leverage and...Ch. 3 - Learning Goal 4 P3-21 Analysis of debt ratios...Ch. 3 - Learning Goal 6 P3-22 Ratio proficiency McDougal...Ch. 3 - Learning Goal 6 P3-23 Cross-sectional ratio...Ch. 3 - Learning Goal 6 P3-24 Financial statement analysis...Ch. 3 - Learning Goals 6 P3- 25 Integrative: Complete...Ch. 3 - Learning Goal 6 P3-26 DuPont system of analysis...Ch. 3 - Learning Goal 6 P3-27 Complete ratio analysis,...Ch. 3 - Spreadsheet Exercise The income statement and...
Knowledge Booster


Learn more about
Need a deep-dive on the concept behind this application? Look no further. Learn more about this topic, finance and related others by exploring similar questions and additional content below.Similar questions
- 3-28A. (Learning Objective 6: Analyze and evaluate liquidity and debt-paying ability)Peyton Company reported these ratios at December 31, 2018 (dollar amounts in millions):Current ratio = $20 = 2.00 $10$70 Debt ratio = = 0.57 $40Peyton Company completed these transactions during 2019:a. Purchased equipment on account, $5b. Paid long-term debt, $5c. Collected cash from customers in advance, $4d. Accrued interest expense, $3e. Made cash sales, $7Determine whether each transaction improved or hurt the company’s current ratio and debt ratio.arrow_forward(Learning Objective 7: Calculate return on assets) Hometown Supply Companyreported the following information in its comparative financial statements for the fiscal yearended January 31, 2018:January 31,2018January 31,2017Net sales....................................Net earnings..............................Average total assets...................$84,000$ 4,200$70,000$82,600$ 4,050$69,450Requirements1. Compute the net profit margin ratio for the years ended January 31, 2018, and 2017. Did itimprove or worsen in 2018?2. Compute asset turnover for the years ended January 31, 2018, and 2017. Did it improve orworsen in 2018?3. Compute return on assets for the years ended January 31, 2018, and 2017. Did it improveor worsen in 2018? Which component—net profit margin ratio or asset turnover—wasmostly responsible for the change in the company’s return on assets?arrow_forwardQuestion # 5: You are a financial manager in Gama Corporation. You have the task of getting the company back into a sound financial position. Gama Corporation’s 2017 and 2018 balance sheets and income statements, together with projections for 2019, are shown in the following tables. The tables also show the 2017 and 2018 financial ratios, along with the industry average data. Your assignment is to answer the following questions. Provide clear explanations, not yes or no answers. Show your work for the calculations. Balance Sheets Assets 2017 2018 2019 (Projected) Cash $ 9,000 $ 7,282 $ 14,000 Short-Term Investments. 48,600 20,000 71,632 Accounts Receivable 351,200 632,160 878,000 Inventories 715,200 1,287,360 1,716,480 Total Current Assets $ 1,124,000 $ 1,946,802 $ 2,680,112 Gross Fixed Assets 491,000…arrow_forward
- (Learning Objective 4: Construct the financial statements) Suppose Robin SportingGoods Company reported the following data at July 31, 2018, with amounts in thousands:Cost of goods sold................. $136,800Cash...................................... 50,000Property and equipment, net ... 19,400Common stock...................... 26,000Inventories ............................ 36,000Long-term liabilities.............. 11,700Dividends.............................. 0Retained earnings,July 31, 2017 ............ $ 31,500Accounts receivable....... 34,000Net revenues ................. 191,000Total current liabilities.. 80,000All other expenses......... 29,000Other current assets ...... 5,000Other assets................... 30,000Use these data to prepare Robin Sporting Goods Company’s single-step income statement forthe year ended July 31, 2018; statement of retained earnings for the year ended July 31, 2018;and classified balance sheet at July 31, 2018. Use the report format for the balance…arrow_forwardS1-12. (Learning Objective 4: Construct an income statement) MacKensie ServicesCorporation began 2018 with total assets of $230 million and ended 2018 with totalassets of $365 million. During 2018, MacKensie earned revenues of $394 million and hadexpenses of $171 million. MacKensie declared and paid dividends of $27 million in 2018.Prepare the company’s income statement for the year ended December 31, 2018, completewith an appropriate heading.arrow_forward(Learning Objective 4, 5: Assess the effects of transactions on a company)Suppose United Cable and Entertainment, Inc., is having a bad year in 2018, because thecompany has incurred a $4.9 billion net loss. The loss has pushed most of the company’s returnmeasures into the negative column, and its current ratio dropped below 1.0. The company’s debtratio is still only 0.27. Top management of United Cable and Entertainment is considering waysto improve the company’s ratios, including the following possible transactions:1. Selling off the cable television segment of the business for $30 million (receiving half incash and half in the form of a long-term note receivable). The book value of the cable television business is $27 million.2. Borrowing $100 million on long-term debt.3. Purchasing treasury stock for $500 million cash.4. Writing off one-fourth of the goodwill carried on the books at $128 million.5. Selling advertising at the normal gross profit of 60%. The advertisements run…arrow_forward
- Perform a horizontal analysis of the MLC balance sheet (Table 4–4).a. Compare assets, liabilities, and owner’s equity from one year to the next.b. Is the corporation better off in 2013 or in 2012?arrow_forwardProblem 1: Viance Queen Company Required: Compute for the company’s profitability and operating efficiency ratios for 2019 Compute for the financial health ratios of the company for 2019 A.Profitability ratio a.Gross Profit Ratio b. Operating income margin c. Net profit margin d. Return on Assets: ROA (NI/Total Assets) ROA (NI/Average Assets) ROA (EBIT/Total Assets) ROA (EBIT/Average Assets) ROE (NI/Capital) ROE (NI/Average Capital B.Operating Efficiency a. Asset Turnover b. Fixed Asset Turnover c. Inventory Turnover d. Days in Inventory e. AR Turnover f. Days in AR C.Financial Health/ (Solvency and Liquidity) Solvency ratio: a. Debt to equity ratio b. Debt Ratio c. Equity Ratio d. Interest Coverage Ratio Liquidity ratio: a. Current Ratio b. Quick Ratioarrow_forwardSub : AccountingPls answer very fast.I ll upvote correct answer. Thank You Financial information for Sigma Company is presented below. Calculate the following ratios for Year 2.(a) Inventory turnover.(b) Accounts receivable turnover.(c) Return on total assets.(d) Times interest earned.(e) Total asset turnover. Year 2 Year 1 Assets: Cash $ 18,000 $ 22,000 Marketable securities 25,000 0 Accounts receivable 38,000 42,000 Inventory 61,000 52,000 Prepaid insurance 6,000 9,000 Long-term investments 49,000 20,000 Plant assets, net 218,000 225,000 Total assets $ 415,000 $ 370,000 Net income after interest expense and taxes $ 62,250 Sales (all on credit) 305,000 Cost of goods sold 123,000 Interest expense 15,600 Income tax expense 27,000arrow_forward
- E1-34B. (Learning Objectives 3, 4: Apply the accounting equation; evaluate business operations) Pillser, Inc.’s, comparative balance sheet at January 31, 2019, and 2018, reports the following (in millions):2019 2018Total assets $72 $49Total liabilities 23 17RequirementsThe following are three situations related to Pillser’s issuance of stock and declaration and payment of dividends during the year ended January 31, 2019. For each situation, use the accounting equation and what you know from the chapter about stockholders’ equity, common stock,and retained earnings to calculate the amount of Pillser’s net income or net loss during the yearended January 31, 2019.1. Pillser issued $3 million of stock and declared no dividends.2. Pillser issued no stock but declared dividends of $4 million.3. Pillser issued $20 million of stock and declared dividends of $8 millionarrow_forwardUsing the accounting equation Thompson Handyman Services has total assets for the year of $18,400 and total liabilities of $9,050. Requirements Use the accounting equation to solve for equity. If next year's assets increased by $4,300 and equity decreased by $3,850, what would be the amount of total liabilities for Thompson Handyman Services?arrow_forward
arrow_back_ios
arrow_forward_ios
Recommended textbooks for you
 Financial AccountingAccountingISBN:9781337272124Author:Carl Warren, James M. Reeve, Jonathan DuchacPublisher:Cengage Learning
 Fundamentals of Financial Management (MindTap Cou...FinanceISBN:9781285867977Author:Eugene F. Brigham, Joel F. HoustonPublisher:Cengage Learning
Financial Accounting
Accounting
ISBN:9781337272124
Author:Carl Warren, James M. Reeve, Jonathan Duchac
Publisher:Cengage Learning
Fundamentals of Financial Management (MindTap Cou...
Finance
ISBN:9781285867977
Author:Eugene F. Brigham, Joel F. Houston
Publisher:Cengage Learning
Financial ratio analysis; Author: The Finance Storyteller;https://www.youtube.com/watch?v=MTq7HuvoGck;License: Standard Youtube License