(a)
To obtain: The proportion of observations from a standard
To sketch: The standard normal curve for
(a)
Answer to Problem 3.28E
The proportion of observations from a standard normal distribution that falls in
The standard normal curve for
Explanation of Solution
Calculation:
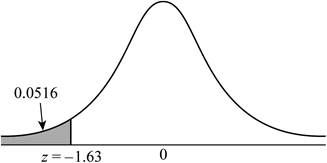
The z-score less than or equal to –1.63 represents the proportion of observations to the left of −1.63.
Use Table A: Standard normal cumulative proportions to find the area to the left of –1.63.
Procedure:
- Locate –1.6 in the left column of the table.
- Obtain the value in the corresponding row below 0.03.
That is,
Thus, the proportion of observations from a standard normal distribution that falls in
Shade the region to the left of

Figure (1)
The shaded region represents the proportion of observations less than or equal to –1.63.
(b)
To obtain: The proportion of observations from a standard normal distribution that falls in
To sketch: The standard normal curve for
(b)
Answer to Problem 3.28E
The proportion of observations from a standard normal distribution that falls in
The standard normal curve for
Explanation of Solution
Calculation:
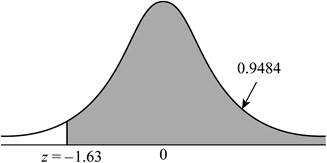
The z-score greater than or equal to –1.63 represents the proportion of observations to the right of −1.63. But, Table A: Standard normal cumulative proportions apply only for the cumulative areas to the left.
Use Table A: Standard normal cumulative proportions to find the area to the left of –1.63.
Procedure:
- Locate –1.6 in the left column of the table.
- Obtain the value in the corresponding row below 0.03.
That is,
The area to the right of –1.63 is,
Thus, the proportion of observations from a standard normal distribution that falls in
Shade the region to the left of

Figure (2)
The shaded region in Figure (2) represents the proportion of observations greater than or equal to –1.63.
(c)
To obtain: The proportion of observations from a standard normal distribution that falls in
To sketch: The standard normal curve for
(c)
Answer to Problem 3.28E
The proportion of observations from a standard normal distribution that falls in
The standard normal curve for
Explanation of Solution
Calculation:
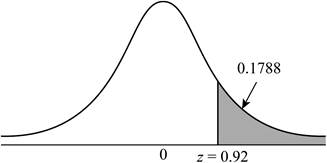
The z-score greater than 0.92 represents the proportion of observations to the right of 0.92. But, Table A: Standard normal cumulative proportions apply only for the cumulative areas to the left.
Use Table A: Standard normal cumulative proportions to find the area to the left of 0.92.
Procedure:
- Locate 0.9 in the left column of the table.
- Obtain the value in the corresponding row below 0.02.
That is,
The area to the right of 0.92 is,
Thus, the proportion of observations from a standard normal distribution that falls in
Shade the region to the left of
Figure (3)
The shaded region represents the proportion of observations greater than or equal to 0.92.
d)
To obtain: The proportion of observations from a standard normal distribution that falls in
To sketch: The standard normal curve for
d)
Answer to Problem 3.28E
The proportion of observations from a standard normal distribution that falls in
The standard normal curve for

Explanation of Solution
Calculation:
The z-score between –1.63 and 0.92 represents the proportion of observations to the right of –1.63 and to the left of 0.92.
Use Table A: Standard normal cumulative proportions to find the areas.
Procedure:
For z at –1.63,
- Locate –1.6 in the left column of the table.
- Obtain the value in the corresponding row below 0.03.
That is,
For z at 0.92,
- Locate 0.9 in the left column of the table.
- Obtain the value in the corresponding row below 0.02.
That is,
Hence, the difference between the areas to the left of –0.42 and the left of 2.12 is,
Thus, the proportion of observations from a standard Normal distribution that takes values between –1.63 and 0.92 is 0.7696.
Shade the region to the right of
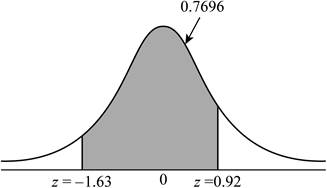
Figure (4)
The shaded region represents the proportion of observations between –1.63 and 0.92
Want to see more full solutions like this?
Chapter 3 Solutions
The Basic Practice of Statistics

 MATLAB: An Introduction with ApplicationsStatisticsISBN:9781119256830Author:Amos GilatPublisher:John Wiley & Sons Inc
 Probability and Statistics for Engineering and th...StatisticsISBN:9781305251809Author:Jay L. DevorePublisher:Cengage Learning
 Statistics for The Behavioral Sciences (MindTap C...StatisticsISBN:9781305504912Author:Frederick J Gravetter, Larry B. WallnauPublisher:Cengage Learning
 Elementary Statistics: Picturing the World (7th E...StatisticsISBN:9780134683416Author:Ron Larson, Betsy FarberPublisher:PEARSON
 The Basic Practice of StatisticsStatisticsISBN:9781319042578Author:David S. Moore, William I. Notz, Michael A. FlignerPublisher:W. H. Freeman
 Introduction to the Practice of StatisticsStatisticsISBN:9781319013387Author:David S. Moore, George P. McCabe, Bruce A. CraigPublisher:W. H. Freeman