Elementary Statistics: A Step By Step Approach
9th Edition
ISBN: 9780073534985
Author: Allan Bluman
Publisher: McGraw-Hill Science/Engineering/Math
Question
Book Icon
Chapter 3, Problem 3.3.23RE

a.

To determine

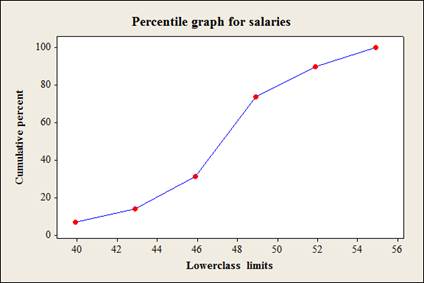
To construct: A percentile graph for the given data.

a.

Expert Solution
Check Mark

Answer to Problem 3.3.23RE

The percentile graph for the given data is as follows,

Elementary Statistics: A Step By Step Approach, Chapter 3, Problem 3.3.23RE

Explanation of Solution

Given info:

The data represents the salaries (in millions of dollars) for 29 NFL teams for the 1999 2000 season.

Class limits Frequency
39.9-42.8 2
42.9-45.8 2
45.9-48.8 5
48.9-51.8 5
51.8-54.8 12
54.9-57.8 3

Calculation:

The cumulative frequency for the distribution is calculated and tabulated below,

Class limits Frequency Cumulative frequency
39.9-42.8 2 2
42.9-45.8 2 2+2=4
45.9-48.8 5 4+5=9
48.9-51.8 5 9+5=14
51.8-54.8 12 14+12=26
54.9-57.8 3 26+3=29

The formula to calculate the cumulative percentage is as follows,

Cumulative%=Cumulativefrequencyn×100%

For the cumulative frequency 2:

Substitute cumulative frequency as 2 and n as 29 in the formula,

Cumulative%=229×100%=6.89%

Similarly for remaining values the cumulative percent are tabulated below

Class limit Frequency

Cumulative

frequency

Cumulative percent
39.9-42.8 2 2 6.89
42.9-45.8 2 4 429×100=13.79
45.9-48.8 5 9 929×100=31.03
48.9-51.8 5 14 1429×100=73.68
51.9-54.8 12 26 2629×100=89.65
54.9-57.8 3 29 2929×100=100
  f=29    

Software procedure:

Step-by-step software procedure to draw ogive curve using MINITAB software is as follows:

  • Choose Graph > Scatter plot.
  • Choose With Connect Line, and then click OK.
  • In Y variables, enter the Cumulative Percent.
  • In X variables enter the Lower class limits.
  • In Data view, select Symbols and Connect line under Data display.
  • In Data view, select Smoother and enter 0 for Degree of smoothing and 1 for Number of steps under Lowness.
  • Click OK
  • To modify the interval settings, double click on the horizontal axis of the graph. Then, select Labels > Specified. In this box, enter the values for the cutpoints of the bin intervals (39.9, 42.9, 45.9, 48.9, 51.9, 54.9).

b.

To determine

The values that correspond to the 35th, 65th and 85th percentiles.

b.

Expert Solution
Check Mark

Answer to Problem 3.3.23RE

The values corresponding to 35th, 65th and 85th percentile are 50, 53 and 55.

Explanation of Solution

Calculation:

From part (a) the cumulative percent table is as follows,

Class limit Frequency

Cumulative

frequency

Cumulative

percent

39.9-42.8 2 2 6.89
42.9-45.8 2 4 13.79
45.9-48.8 5 9 31.03
48.9-51.8 5 14 73.68
51.9-54.8 12 26 89.65
54.9-57.8 3 29 100
  f=29    

For 35th percentile:

The 35th percentile location is calculated below,

Substitute n as 29 and m as 35 in the formula,

c=35×29100=1,015100=10.15

Here the 10th observation corresponds to the cumulative frequency 14 which falls in the class 48.9-51.8.

The formula to calculate the percentile for the grouped data is given below,

Pm=l+hf(m.n100c)

Where,

  • l, the lower limit of the class.
  • h, the width of class.
  • f, the frequency of the class.
  • p, the percentiles rank.
  • n is the total number
  • c is the preceding cumulative frequency

Substitute 35 for m, 48.9 for l , 3 for h , 5 for f , 29 for n and 9 for c in the above formula,

P35=48.9+35(35×291009)=48.9+35(10.129)=48.9+0.672=49.57

Thus, the 35th percentile of the data is approximately 50.

For 65th percentile:

The 65th percentile location is calculated below,

Substitute n as 29 and m as 65 in the formula,

c=65×29100=1,885100=18.85

Here the 19th observation corresponds to the cumulative frequency 26 which falls in the class 51.9-54.8.

Substitute 65 for m, 51.9 for l , 3 for h , 12 for f , 29 for n and 14 for c in the formula,

P65=51.9+312(65×2910014)=51.9+312(18.8514)=51.9+1.21=53.11

Thus, the 65th percentile of the data is approximately 53.

For 85th percentile:

The 85th percentile location is calculated below,

Substitute n as 29 and m as 85 in the formula,

c=85×29100=2,465100=24.65

Here the 25th observation corresponds to the cumulative frequency 26 which falls in the class 51.9-54.8.

Substitute 85 for m, 51.9 for l , 3 for h , 12 for f , 29 for n and 14 for c in the formula,

P85=51.9+312(85×2910014)=51.9+312(24.6514)=51.9+2.66=54.56

Thus, the 85th percentile of the data is approximately 55.

c.

To determine

The percentile rank of values 44, 48 and 54.

c.

Expert Solution
Check Mark

Answer to Problem 3.3.23RE

The percentile rank for values 44, 48 and 54 are 10th, 26th and 78th respectively.

Explanation of Solution

Calculation:

Class limit Frequency

Cumulative

frequency

39.9-42.8 2 2
42.9-45.8 2 4
45.9-48.8 5 9
48.9-51.8 5 14
51.9-54.8 12 26
54.9-57.8 3 29
  f=29  

For the value 44:

Here, the value 44 falls in the interval 42.9-45.8.

Substitute 44 for Pm , 42.9 for l , 3 for h , 2 for f , 29 for n and 2 for c in the formula,

      Pm=l+hf(m.n100c)44=42.9+32(m×291002)44=42.9+1.5(0.29m2)44=42.9+0.435m3

44=39.9+0.435m0.435m=4439.9m=4.10.435=9.43

                 10

Thus, the percentile rank for the value 44 is 10th percentile.

For the value 48:

Here, the value 48 falls in the interval 45.9-48.8

Substitute 48 for Pm , 48.9 for l , 3 for h , 5 for f , 29 for n and 9 for c in the above formula,

       Pm=l+hf(m.n100c)48=48.9+35(m×291009)48=48.9+0.6(0.29m9)48=48.9+0.174m5.4

48=43.5+0.174m0.174m=4843.5m=4.50.174=25.86

               26

Thus, the percentile rank for the value 48 is 26th percentile.

For the value 48:

Here, the value 48 falls in the interval 51.9-54.8

Substitute 54 for Pm 51.9 for l , 3 for h , 12 for f , 29 for n and 14 for c in the above formula,

         Pm=l+hf(m.n100c)54=51.9+312(m×2910014)54=51.9+312(0.29m14)54=51.9+0.0725m3.5

54=48.4+0.0725m0.0725m=5448.4m=5.60.0725=77.24

                 78

Thus, the percentile rank for the value 54 is 78th percentile

Want to see more full solutions like this?

Subscribe now to access step-by-step solutions to millions of textbook problems written by subject matter experts!

Chapter 3 Solutions

Elementary Statistics: A Step By Step Approach

Ch. 3.1 - Foreign Workers The number of foreign workers...Ch. 3.1 - Distances of Stars Of the 25 brightest stars, the...Ch. 3.1 - Contest Spelling Words The last words given and...Ch. 3.1 - Prob. 13ECh. 3.1 - Hourly Compensation for Production Workers The...Ch. 3.1 - Prob. 15ECh. 3.1 - Percentage of Foreign-Born People The percentage...Ch. 3.1 - Percentage of College-Educated Population over 25...Ch. 3.1 - Net Worth of Corporations These data represent the...Ch. 3.1 - Specialty Coffee Shops A random sample of 30...Ch. 3.1 - Commissions Earned This frequency distribution...Ch. 3.1 - Prob. 21ECh. 3.1 - Enrollments for Selected Independent Religiously...Ch. 3.1 - Automobile Selling Prices Find the weighted mean...Ch. 3.1 - Fat Grams Using the weighted mean, find the...Ch. 3.1 - Diet Cola Preference A recent survey of a new diet...Ch. 3.1 - Costs of Helicopters The costs of three models of...Ch. 3.1 - Final Grade An instructor grades exams, 20%; term...Ch. 3.1 - Final Grade Another instructor gives four 1-hour...Ch. 3.1 - For these situations, state which measure of...Ch. 3.1 - Describe which measure of central tendencymean,...Ch. 3.1 - What types of symbols are used to represent sample...Ch. 3.1 - A local fast-food company claims that the average...Ch. 3.1 - If the mean of five values is 64, find the sum of...Ch. 3.1 - If the mean of five values is 8.2 and four of the...Ch. 3.1 - Find the mean of 10, 20, 30, 40, and 50. a. Add 10...Ch. 3.1 - Harmonic Mean The harmonic mean (HM) is defined as...Ch. 3.1 - Geometric Mean The geometric mean (GM) is defined...Ch. 3.1 - Quadratic Mean A useful mean in the physical...Ch. 3.1 - Median for Grouped Data An approximate median can...Ch. 3.2 - Blood Pressure The table lists means and standard...Ch. 3.2 - What is the relationship between the variance and...Ch. 3.2 - Why might the range not be the best estimate of...Ch. 3.2 - What are the symbols used to represent the...Ch. 3.2 - What are the symbols used to represent the sample...Ch. 3.2 - Why is the unbiased estimator of variance used?Ch. 3.2 - The three data sets have the same mean and range,...Ch. 3.2 - Prob. 7ECh. 3.2 - Cigarette Taxes The increases (in cents) in...Ch. 3.2 - Prob. 9ECh. 3.2 - Size of U.S. States The total surface area (in...Ch. 3.2 - Multiple Births The numbers of various multiple...Ch. 3.2 - Starting Teachers Salaries Starting teachers...Ch. 3.2 - Ages of U.S. Astronaut Candidates The average age...Ch. 3.2 - Times Spent in Rush-Hour Traffic A sample of 12...Ch. 3.2 - Prob. 15ECh. 3.2 - Passenger Vehicle Deaths The number of people...Ch. 3.2 - Annual Precipitation Days The number of annual...Ch. 3.2 - Use the data from Exercises 7, 15, and 17...Ch. 3.2 - Prob. 19ECh. 3.2 - Automotive Fuel Efficiency Thirty automobiles were...Ch. 3.2 - Murders in Cities The data show the number of...Ch. 3.2 - Reaction Times In a study of reaction times to a...Ch. 3.2 - FM Radio Stations A random sample of 30 states...Ch. 3.2 - Murder Rates The data represent the murder rate...Ch. 3.2 - Prob. 25ECh. 3.2 - Prob. 26ECh. 3.2 - Missing Work The average number of days that...Ch. 3.2 - Suspension Bridges The lengths (in feet) of the...Ch. 3.2 - Hospital Emergency Waiting Times The mean of the...Ch. 3.2 - Ages of Accountants The average age of the...Ch. 3.2 - Using Chebyshevs theorem, solve these problems for...Ch. 3.2 - The mean of a distribution is 20 and the standard...Ch. 3.2 - In a distribution of 160 values with a mean of 72,...Ch. 3.2 - Calories in Bagels The average number of calories...Ch. 3.2 - Time Spent Online Americans spend an average of 3...Ch. 3.2 - Solid Waste Production The average college student...Ch. 3.2 - Sale Price of Homes The average sale price of...Ch. 3.2 - Trials to Learn a Maze The average of the number...Ch. 3.2 - Farm Sizes The average farm in the United States...Ch. 3.2 - Citrus Fruit Consumption The average U.S. yearly...Ch. 3.2 - SAT Scores The national average for mathematics...Ch. 3.2 - Work Hours for College Faculty The average...Ch. 3.2 - Serum Cholesterol Levels For this data set, find...Ch. 3.2 - Ages of Consumers For this data set, find the mean...Ch. 3.2 - Prob. 45ECCh. 3.2 - Use this data set: 10, 20, 30, 40, 50 a. Find the...Ch. 3.2 - Mean Deviation The mean deviation is found by...Ch. 3.2 - All values of a data set must be within sn1 of the...Ch. 3.2 - Pearson Coefficient of Skewness A measure to...Ch. 3.3 - Determining Dosages In an attempt to determine...Ch. 3.3 - What is a z score?Ch. 3.3 - Define percentile rank.Ch. 3.3 - What is the difference between a percentage and a...Ch. 3.3 - Define quartile.Ch. 3.3 - What is the relationship between quartiles and...Ch. 3.3 - What is a decile?Ch. 3.3 - How are deciles related to percentiles?Ch. 3.3 - To which percentile, quartile, and decile does the...Ch. 3.3 - Vacation Days If the average number of vacation...Ch. 3.3 - Age of Senators The average age of Senators in the...Ch. 3.3 - Prob. 11ECh. 3.3 - Teachers Salary The average teachers salary in a...Ch. 3.3 - Prob. 13ECh. 3.3 - College and University Debt A student graduated...Ch. 3.3 - Annual Miles Driven The average miles driven...Ch. 3.3 - Which score indicates the highest relative...Ch. 3.3 - College Room and Board Costs Room and board costs...Ch. 3.3 - Prob. 19ECh. 3.3 - Airplane Speeds The airborne speeds in miles per...Ch. 3.3 - Average Weekly Earnings The average weekly...Ch. 3.3 - Test Scores Find the percentile rank for each test...Ch. 3.3 - Hurricane Damage Find the percentile rank for each...Ch. 3.3 - Test Scores Find the percentile rank for each test...Ch. 3.3 - Prob. 25ECh. 3.3 - Prob. 26ECh. 3.3 - Prob. 27ECh. 3.3 - Police Calls in Schools The number of incidents in...Ch. 3.3 - Prob. 29ECh. 3.3 - Check each data set for outliers. a. 88, 72, 97,...Ch. 3.3 - Another measure of the average is called the...Ch. 3.3 - An employment evaluation exam has a variance of...Ch. 3.3 - A particular standardized test has scores that...Ch. 3.4 - Applying the Concepts 34 The Noisy Workplace...Ch. 3.4 - For Exercises 16, identify the five-number summary...Ch. 3.4 - For Exercises 16, identify the five-number summary...Ch. 3.4 - For Exercises 16, identify the five-number summary...Ch. 3.4 - For Exercises 16, identify the five-number summary...Ch. 3.4 - For Exercises 16, identify the five-number summary...Ch. 3.4 - For Exercises 16, identify the five-number summary...Ch. 3.4 - For Exercises 710, use each boxplot to identify...Ch. 3.4 - For Exercises 710, use each boxplot to identify...Ch. 3.4 - For Exercises 710, use each boxplot to identify...Ch. 3.4 - For Exercises 7-10. use each boxplot to identify-...Ch. 3.4 - Prob. 11ECh. 3.4 - Prob. 12ECh. 3.4 - Prob. 13ECh. 3.4 - Visitors Who Travel to Foreign Countries Construct...Ch. 3.4 - Prob. 15ECh. 3.4 - Size of Dams These data represent the volumes in...Ch. 3.4 - Prob. 17ECh. 3.4 - Prob. 18ECh. 3.4 - Unhealthy Smog Days A modified boxplot can be...Ch. 3 - Prob. 3.1.1RECh. 3 - Shark Attacks The number of shark attacks and...Ch. 3 - Prob. 3.1.3RECh. 3 - SAT Scores The mean SAT math scores for selected...Ch. 3 - Households of Four Television Networks A survey...Ch. 3 - Investment Earnings An investor calculated these...Ch. 3 - Prob. 3.2.7RECh. 3 - Tallest Buildings The number of stories in the 13...Ch. 3 - Rise in Tides Shown here is a frequency...Ch. 3 - Fuel Capacity The fuel capacity in gallons for...Ch. 3 - If the range of a data set is 24, find the...Ch. 3 - If the range of a data set is 56, find the...Ch. 3 - Textbooks in Professors Offices If the average...Ch. 3 - Magazines in Bookstores A survey of bookstores...Ch. 3 - Cost of Car Rentals A survey of car rental...Ch. 3 - AID: 1825 | 28/05/2018 16. Average Earnings of...Ch. 3 - Labor Charges The average labor charge for...Ch. 3 - Costs to Train Employees For a certain type of...Ch. 3 - Prob. 3.2.19RECh. 3 - Exam Completion Time The mean time it takes a...Ch. 3 - Prob. 3.2.21RECh. 3 - Exam Grades Which of these exam grades has a...Ch. 3 - Prob. 3.3.23RECh. 3 - Printer Repairs The frequency distribution shows...Ch. 3 - Check each data set for outliers. a. 506, 511,...Ch. 3 - Check each data set for outliers. a. 14, 18, 27,...Ch. 3 - Named Storms The data show the number of named...Ch. 3 - Hours Worked The data shown here represent the...Ch. 3 - From the Data Bank, choose one of the following...Ch. 3 - Prob. 2DACh. 3 - Prob. 3DACh. 3 - Randomly select 10 values from the number of...Ch. 3 - Prob. 5DACh. 3 - AID: 1825 | 28/05/2018 Determine whether each...Ch. 3 - Prob. 2CQCh. 3 - Determine whether each statement is true or false....Ch. 3 - Prob. 4CQCh. 3 - In a data set, the mode will always be unique.Ch. 3 - Prob. 6CQCh. 3 - Determine whether each statement is true or false....Ch. 3 - Prob. 8CQCh. 3 - Determine whether each statement is true or false....Ch. 3 - Prob. 10CQCh. 3 - Prob. 11CQCh. 3 - Prob. 12CQCh. 3 - Which is not part of the five-number summary? a....Ch. 3 - A statistic that tells the number of standard...Ch. 3 - When a distribution is bell-shaped, approximately...Ch. 3 - Prob. 16CQCh. 3 - Generally, Greek letters are used to represent...Ch. 3 - Prob. 18CQCh. 3 - The symbol for the population standard deviation...Ch. 3 - When the sum of the lowest data value and the...Ch. 3 - If the mode is to the left of the median and the...Ch. 3 - An extremely high or extremely low data value is...Ch. 3 - Prob. 23CQCh. 3 - Prob. 24CQCh. 3 - Employee Years of Service In an advertisement, a...Ch. 3 - Newspapers for Sale The average number of...Ch. 3 - Prob. 27CQCh. 3 - Hours Worked The data shown here represent the...Ch. 3 - Prob. 29CQCh. 3 - Prob. 30CQCh. 3 - Exam Scores On a philosophy comprehensive exam,...Ch. 3 - Prob. 32CQCh. 3 - Prob. 1CTCCh. 3 - Ages of U.S. Residents The table shows the median...
Knowledge Booster
Background pattern image
Recommended textbooks for you
Text book image
MATLAB: An Introduction with Applications
Statistics
ISBN:9781119256830
Author:Amos Gilat
Publisher:John Wiley & Sons Inc
Text book image
Probability and Statistics for Engineering and th...
Statistics
ISBN:9781305251809
Author:Jay L. Devore
Publisher:Cengage Learning
Text book image
Statistics for The Behavioral Sciences (MindTap C...
Statistics
ISBN:9781305504912
Author:Frederick J Gravetter, Larry B. Wallnau
Publisher:Cengage Learning
Text book image
Elementary Statistics: Picturing the World (7th E...
Statistics
ISBN:9780134683416
Author:Ron Larson, Betsy Farber
Publisher:PEARSON
Text book image
The Basic Practice of Statistics
Statistics
ISBN:9781319042578
Author:David S. Moore, William I. Notz, Michael A. Fligner
Publisher:W. H. Freeman
Text book image
Introduction to the Practice of Statistics
Statistics
ISBN:9781319013387
Author:David S. Moore, George P. McCabe, Bruce A. Craig
Publisher:W. H. Freeman