
a.
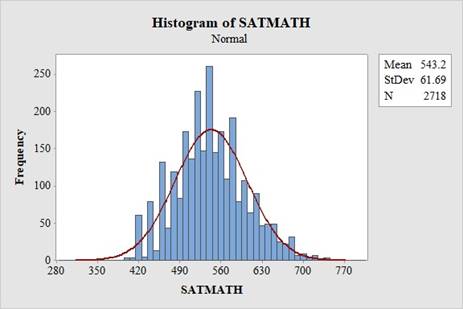
To draw: A histogram with a superimposed normal curve.
a.
Answer to Problem 3.49E
The obtained histogram with a superimposed normal curve is,
Explanation of Solution
Given info:
The data of SATMATH are given.
Calculation:
Histogram:
Software Procedure:
Step by step procedure to obtain Histogram is given as:
- Choose Graph > Histogram.
- Choose With Fit, and then click OK.
- In Graph variables, enter the corresponding data column SATMATH.
- Click OK.
The output using Minitab software is given as:
b.
To find: The mean, median, standard deviations and
To compare: The mean and the median.
To compare: The quartiles.
b.
Answer to Problem 3.49E
The mean, median, standard deviation, 1st quartile, 2nd quartile are 543.2, 540, 61.69, 500 and 580, respectively.
The distribution is symmetric.
Explanation of Solution
Calculation:
Software Procedure:
Step by step procedure to obtain the inter
- Choose Stat > Basic Statistics > Display Descriptive Statistics.
- In Variables enter the columns SAT.
- In statistics choose Mean, Median, Standard deviation, 1st quartile, 3rd quartile..
- Click OK.
Output using the MINITAB software is given below:
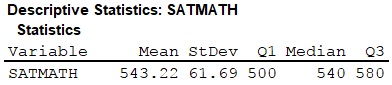
From the MINITAB output,
The mean is 543.2.
The standard deviation is 61.69.
The 1st quartile is 500.
The median is 540.
The 3rd quartile is 580.
Comparison between mean and median:
If mean is equal to the median then it is said to be symmetric.
Here, the mean is close to the median. Thus, the distribution is symmetric.
Distance of the first quartile from the median:
The formula to find the distance of the first quartile from the median is,
Thus, the distance of the first quartile from the median is 40.
Distance of the first quartile from the median:
The formula to find the distance of the third quartile from the median is,
Thus, the distance of the third quartile from the median is 40.
Here, the distance of the first quartile from the median is approximately equal to distance of the third quartile from the median. That is,
Hence, the distribution of the rainwater specimens is quite symmetric.
c.
To find: The proportion of GSU freshmen scored above the mean 514 for all college-bound seniors.
c.
Answer to Problem 3.49E
The proportion of GSU freshmen scored above the mean 514 for all college-bound seniors is 0.6808.
Explanation of Solution
The formula to find the standardized score is,
In 2013, the mean score on the mathematics portion of the SAT for all college-bound seniors was 514.
The distribution of first 20 SAT mathematics scores follow
Consider the random variable X, denotes those students of first 20 SAT mathematics scores.
Thus,
It is known that,
Thus,
Cumulative probability value:
Software Procedure:
Step by step procedure to obtain the graph using the MINITAB software:
- Choose Calc > Probability distribution> Normal.
- Choose Cumulative Probability.
- In mean, enter 0.
- In standard deviation, enter 1.
- Choose Input Constant.
- In Input Constant, enter -0.47.
- Click OK.
Output using the MINITAB software is given below:
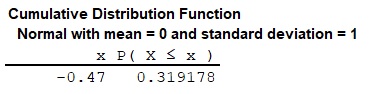
Thus,
Therefore, the proportion of GSU freshmen scored above the mean for all college-bound seniors is 0.6808.
d.
To find: The exact proportion of GSU freshmen who scored above the mean for all college-bound seniors.
d.
Answer to Problem 3.49E
The exact proportion of GSU freshmen who scored above the mean for all college-bound seniors is 0.6840.
Explanation of Solution
It is found from the data that 1,859 students, out of a total of 2,718 students have scored above the mean score 514 for all college-bound seniors.
Thus, the exact proportion of GSU freshmen who scored above the mean for all college-bound seniors is:
From part (c), the proportion of GSU freshmen scored above the mean 514 for all college-bound seniors, for normal distribution is 0.6808 or 68.08%.
Here, the exact proportion of GSU freshmen who scored above the mean for all college-bound seniors is 0.6840 or 68.40%.
It can be said that
Thus, the exact percentage obtained from part (d) and the percentage obtained from part (c) are very close.
Thus, despite any discrepancies, the distribution can be considered to be “close enough to Normal” distribution.
Want to see more full solutions like this?
Chapter 3 Solutions
The Basic Practice of Statistics

 MATLAB: An Introduction with ApplicationsStatisticsISBN:9781119256830Author:Amos GilatPublisher:John Wiley & Sons Inc
 Probability and Statistics for Engineering and th...StatisticsISBN:9781305251809Author:Jay L. DevorePublisher:Cengage Learning
 Statistics for The Behavioral Sciences (MindTap C...StatisticsISBN:9781305504912Author:Frederick J Gravetter, Larry B. WallnauPublisher:Cengage Learning
 Elementary Statistics: Picturing the World (7th E...StatisticsISBN:9780134683416Author:Ron Larson, Betsy FarberPublisher:PEARSON
 The Basic Practice of StatisticsStatisticsISBN:9781319042578Author:David S. Moore, William I. Notz, Michael A. FlignerPublisher:W. H. Freeman
 Introduction to the Practice of StatisticsStatisticsISBN:9781319013387Author:David S. Moore, George P. McCabe, Bruce A. CraigPublisher:W. H. Freeman