EBK ECONOMICS: PRINCIPLES AND POLICY
13th Edition
ISBN: 8220100605932
Author: Blinder
Publisher: Cengage Learning US
expand_more
expand_more
format_list_bulleted
Concept explainers
Question
Chapter 3, Problem 3TY
To determine
Explain which case leads to more generous
Expert Solution & Answer
Want to see the full answer?
Check out a sample textbook solution
Students have asked these similar questions
The accompanying hypothetical production possibilities tables are for New Zealand and Spain. Each country can produce apples and
plums.
New Zealand's Production Possibilities Table
(Millions of Bushels)
Production Alternatives.
Product
A
B
с
D
Apples
0
20
40
60
Plums
15
10
5
0
Spain's Production Possibilities Table
(Millions of Bushels)
Production Alternatives
Product
R
S
T
U
Apples
0
20
40
60
Plums
60
40
20
0
a. Plot the production possibilities data for each of the two countries separately. Show the trading possibilities lines for each nation if
the actual terms of trade are 1 plum for 2 apples.
Instructions: (1) Use the tools provided, 'PPC NZ' and 'PPC SP, (plot 4 points each) to draw the PPC curves. (2) Use the
tool provided, 'TOT, in each diagram (plot 4 points each) to draw the trading possibilities lines for each nation. To earn full credit, you
must correctly plot all points for each line.
New Zealand
Spain
80
Tools
140
/
120
TOT
60
100
40
20
10 15 20 25
30
Plums (millions of…
The accompanying hypothetical production possibilities tables are for New Zealand and Spain. Each country can produce apples and
plums.
New Zealand's Production Possibilities Table
(Millions of Bushels)
Spain's Production Possibilities Table
(Millions of Bushels)
Production Alternatives
Production Alternatives
Product
A
B
D
Product
R
T
Apples
20
40
60
Apples
20
40
60
Plums
15
10
5
Plums
60
40
20
a. Plot the production possibilities data for each of the two countries separately. Show the trading possibilities lines for each nation if
the actual terms of trade are 1 plum for 2 apples.
Instructions: (1) Use the tools provided, 'PPC NZ' and 'PPC SP' (plot 4 points each) to draw the PPC curves. (2) Use the
tool provided, 'ToT,' in each diagram (plot 4 points each) to draw the trading possibilities lines for each nation. To earn full credit, you
must correctly plot all points for each line.
New Zealand Customize and control Google Chrome
Spain
80
Tools
140
Tools
120
60
PPC NZ
Тот
PPC sP
ToT…
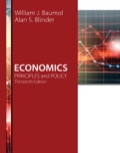
Ice cream (millions of gallons per year)
4.
3.
24
2.
4.
6.
Milk (millions of gallons per year)
The figure above shows the production possibilities frontier for a country A combination of 4 million gallons
of milk and 4 million gallons of ice cream is
attainable and production efficient.
unattainable and production efficient,
) unattainable
attainable and production inefficient.
More information is needed to determnine if the point is attainable or not.
Chapter 3 Solutions
EBK ECONOMICS: PRINCIPLES AND POLICY
Knowledge Booster


Learn more about
Need a deep-dive on the concept behind this application? Look no further. Learn more about this topic, economics and related others by exploring similar questions and additional content below.Similar questions
- What does a point inside the production possibilities frontier (PPF) represent? A. An efficient allocation of resources B. An underutilization of resources C. A technologically advanced production point D. An unattainable production level given current resourcesarrow_forwardThe accompanying hypothetical production possibilities tables are for New Zealand and Spain. Each country can produce apples and plums. New Zealand's Production Possibilities Table Spain's Production Possibilities Table (Millions of Bushels) (Millions of Bushels) Production Alternatives Production Alternatives Product A в D Product R T U Apples 20 40 I 60 Apples 40 20 60 Plums 15 10 5 Plums 60 40 20 a. Plot the production possibilities data for each of the two countries separately. Show the trading possibilities lines for each nation if the actual terms of trade are 1 plum for 2 apples. Instructions: (1) Use the tools provided, 'PPC NZ' and 'PPC SP, (plot 4 points each) to draw the PPC curves. (2) Use the tool provided, 'ToT,' in each diagram (plot 4 points each) to draw the trading possibilities lines for each nation. To earn full credit, you must correctly plot all points for each line. New Zealand Spain 80 Tools 140 Tools 120 PPC NZ PPC SP ToT Тот 60 100 80 40 60 40 20 20 50 (50, 0)…arrow_forwardIf countries X and Y produce only either baseballs or golf balls, their maximum outputs are shown in the accompanying production possibilities schedules. Country X Baseballs 150 50 Golf balls 75 200 Y In country X the opportunity cost of 1 golf ball is Multiple Choice 75 baseballs 2 baseballs. 150 baseballs 05 baseballsarrow_forward
- The table provides data on how long it takes Maia and Juanita to mow the lawn and weed the flower beds. Table: Maia and Juanita Maia Juanita Hours it takes to: Mow the lawn 3 4 Weed the flower beds 1 2 Who has a comparative advantage in weeding the flower beds? Maia because she can weed the beds more quickly. Juanita because she takes the time to weed the beds carefully. Maia because she has a lower opportunity cost. Juanita because she has a lower opportunity cost.arrow_forwardDraw another diagram putting on it the original production possibility frontier you drew for (a), labelling it AA. (i) Draw a new production possibility frontier on the diagram, labelling it PP, which shows the position after a devastating war has hit the economy. (ii) Draw another PPF labelling it QQ which shows an increase in productivity in the econory such that output from the same amount of resources increases by 50 per cent in the public sector but twice that amount in the private sector. already finished part A need help with part B thanks!arrow_forward+1 >> CENGAGE MINDTAP Homework: Chapter 02 3. Shifts in production possibilities Suppose France produces two types of goods: agricultural goods and capital good. The following graph shows its current production possibilities frontier (PPF) for corn, an agricultural good, and airplanes, a capital good. On the following graph, adjust the production possibilities frontier (PPF) to show the effects of an improvement in soil quality because of new fertilization techniques. Hint: Select either end of the curve on the graph to make the endpoints appear. Then drag one or both endpoints to the desired position. Points will snap into position, so if you try to move a point and it snaps back to its original position, just drag it a little farther. AIRPLANES (Thousands) 360 300 240 180 120 60 0 0 10 20 30 PPF 40 50 60 CORN (Millions of bushels) PPFarrow_forward
- Farm-A and Farm-B grow the following amounts of potatoes and cabbage in their famrs: Farm-A takes one week to produce 101 units of potatoes and 207 units of cabbages Farm-B takes one week to produce 127 units of potatoes and 169 units of cabbages a) What is the opportunity cost of Farm-A to produce 20 units if cabbages Give your answer in 2 decimal places b) What is the opportunity cost of Farm-B to produce 12 units of potatoes Give your answer in 2 decimal placesarrow_forwardA country produces two goods: coconuts and umbrellas. Their production possibilities frontier (PPF) places coconuts on the x-axis and umbrellas on the y-axis. How would a drought that makes it difficult to grow coconuts but does not affect the production of umbrellas change the PPF? Neither the value of the x-intercept nor the y-intercept would change The value of the y-intercept would increase but the value of the x-intercept would not change The value of the x-intercept would increase but the value of the y-intercept would not change Both the value of the x-intercept and the y-intercept would increase The value of the y-intercept would decrease but the value of the x-intercept would not change The value of the x-intercept would decrease but the value of the y-intercept would not changearrow_forwardPut ECG Machines on the vertical axis and Defibrillators on the horizontal axis. Draw the production possibilities curve for Plant R. On a separate graph, draw the production possibilities curve for Plant S. Which plant has a comparative advantage in ECG Machines? In Defibrillators? Now draw the combined curves for the two plants. Suppose the firm decides to produce 100 Defibrillators. Where will it produce them? How many ECG Machines will it be able to produce? Where will it produce the ECG Machines?arrow_forward
- Explain the following economics concepts with PPF. a)scarcity b)Economic inefficiency c)Economic growtharrow_forwardFood 0 Alpha Shelter Beta In the figure are two linear production possibilities curves for countries Alpha and Beta. We can conclude thatarrow_forwardConsider two countries: Alland and Georgeland. Say that Alland can produce 48 units of food per person per year or 16 units of clothing per person per year, but Georgeland can produce 68 units of food per person per year or 17 units of clothing per person per year. Compute each country's opportunity cost for each product. Tip: The list below contains the correct answers. Enter the correct amount for each of the 4 boxes making sure it is entered exactly as written below. Don’t omit or add space, digits or other characters. 0.25, 0.33, 1.33, 1.25, 1.40, 3, 4, 30, 40 Alland’s opportunity cost of 1 unit of food is [a] unit(s) of clothing Alland’s opportunity cost of 1 unit of clothing is [b] unit(s) of food Georgeland’s opportunity cost of 1 unit of food is [c] unit(s) of clothing Georgeland’s opportunity cost of 1 unit of clothing is [d] unit(s) of food Enter Alland or Georgeland in the appropriate box. Please make sure to enter each name exactly as written here. Don’t omit or add…arrow_forward
arrow_back_ios
SEE MORE QUESTIONS
arrow_forward_ios
Recommended textbooks for you


 Economics (MindTap Course List)EconomicsISBN:9781337617383Author:Roger A. ArnoldPublisher:Cengage Learning
Economics (MindTap Course List)
Economics
ISBN:9781337617383
Author:Roger A. Arnold
Publisher:Cengage Learning