
Concept explainers
Videos
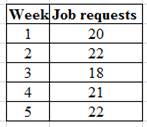
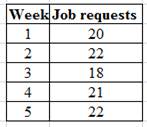
An electrical contractor’s records during the last five weeks indicate the number of job requests:

Predict the number of requests for week 6 using each of these methods:
a. Naive
b. A four-period moving average
c. Exponential smoothing with α = .30; use 20 for week 2
a)
To forecast: The number of requests for week 6 using naïve approach.
Introduction: Forecasting is the planning process that helps to predict the future aspects of the business or operation using present or past data. It uses certain assumptions based the knowledge and experience of the management.
Explanation of Solution
Given information:
Given that an electrical contractor had the following job requests during the last five weeks

Forecast the number of requests for week 6 using the naïve approach as shown below.
Given that the number of job requests for week 5 was 22, the likely job requests for week 6 would also be 22.
b)
To forecast: The number of requests for week 6 using a four-period moving average.
Introduction: Forecasting is the planning process that helps to predict the future aspects of the business or operation using present or past data. It uses certain assumptions based the knowledge and experience of the management.
Explanation of Solution
Given information:
Given that an electrical contractor had the following job requests during the last five weeks
Forecast the number of requests for week6 using a four period moving average as shown below.
Substitute the values to obtain the forecast for week 6 as shown below.
The forecast for week6 would be 20.75
c)
To forecast: The number of requests for week 6 using a exponential smoothing.
Introduction: Forecasting is the planning process that helps to predict the future aspects of the business or operation using present or past data. It uses certain assumptions based the knowledge and experience of the management.
Explanation of Solution
Given information:
Given that an electrical contractor had the following job requests during the last five weeks
Forecast the number of requests for week6 using exponential smoothing as shown below.
Forecast the number of requests for week 6 using an exponential smoothing methodology, given that the forecast for week 2 was 20 and the actual job requests in week 2 was 22, and the exponential smoothing constant
- Given the week 2 forecast was 20, the actual number of jobs in week2 was 22 and the smoothing constant α was 0.3, prepare a forecast for week 3 as shown below.
Therefore, forecasted week3 job requests 20.6.
- Given the week3 forecast was 20.6, the actual number of jobs was 18 and the smoothing constant α was 0.3, prepare a forecast for week4 as shown below.
Therefore, forecasted week4 job requests 19.82.
- Given the week4 forecast was 19.82, the actual number of jobs was 21 and the smoothing constant α was 0.3, prepare a forecast for week5 as shown below.
Therefore, forecasted week5 job requests 20.17.
- Given the week5 forecast was 20.17, the actual number of jobs was 22 and the smoothing constant α was 0.3, prepare a forecast for week 6 as shown below.
Therefore, the forecast for week 6 would be 20.72.
Want to see more full solutions like this?
Chapter 3 Solutions
Operations Management


- Under what conditions might a firm use multiple forecasting methods?arrow_forward2)Auto sales over a 4-month period were forecasted as follows: 89, 98, 105, and 97. The actual results over the 4-month period were as follows: 92, 96, 101, and 100. What was the MAD of the 4-month forecast? (use an excel sheet to make all calaculations and show formulas used in excel)arrow_forwardFreya is a new name in the retail industry that just started off its journey. With the right strategies, the brand’s grandeur will only rise with time. However, the founders really want to predict the customer demand right for the month of June. Hence, they need to figure out the right forecasting techniques. They are considering 2-period Moving Average, Naive technique, and Exponential Smoothing (use any value between .10 - .18 as the value of alpha). Figure out the better forecasting technique among 2 periods Moving Average, Naive technique, and Exponential Smoothing by doing the error calculation. Period Demand 2period Moving Average Naive technique Exponential Smoothing January 80 85 82 70 February 84 82 ** ** March 89 ** ** ** April 95 ** ** ** May 98 ** ** **arrow_forward
- Daily high temperatures in St. Louis for the lastweek were as follows: 93, 94, 93, 95, 96, 88, 90 (yesterday).a) Forecast the high temperature today, using a 3-day movingaverage.b) Forecast the high temperature today, using a 2-day movingaverage.c) Calculate the mean absolute deviation based on a 2-daymoving average.d) Compute the mean squared error for the 2-day movingaverage.e) Calculate the mean absolute percent error for the 2-daymoving average.arrow_forwardBradley's Copiers sells and repairs photocopy machines. The manager needs weekly forecasts of service calls so that he can schedule service personnel. Use the actual demand in the first period for the forecast for the first week so error measurement begins in the second week. The manager uses exponential smoothing with α = 0.7. Forecast the number of calls for week 6, which is next week.arrow_forwardBradley's Copiers sells and repairs photocopy machines. The manager needs weekly forecasts of service calls so that he can schedule service personnel. Use the actual demand in the first period for the forecast for the first week so error measurement begins in the second week. The manager uses exponential smoothing with alpha = 0.5 Forecast the number of calls for week 6, which is next week. Week Actual service calls 1 28 2 36 3 38 4 25 5 25 The forecast for week 6 is ___ service calls (round to two decimals and show your work)arrow_forward
- constants of .6 and .9, develop fo recasts for the sales of VWBeetles. What effect did the smoothing constant have on the forecast?Use MAD to deternline which of the three smoothing constants (.3,.6, or .9) gives the most accurate forecast. ~ (MyLab OperationsManagement also includes a shorter (brief) version of this problem.)arrow_forwardWhat should be our forecast accuracy target if there is a high degree of volatility in customer orders and long lead times? We have a new chief sales officer who is proposing that we should forecast in dollars, not in units/cases. I have never heard of anyone forecasting in dollars. It is true that dollarized forecasts can help Sales in knowing precisely what sales target they should be hitting. But, is it the best practice?arrow_forwardJustify exponential smoothing's superiority to moving averages as a forecasting method.arrow_forward
- A dry cleaner uses exponential smoothing to forecast equipment usage at its main plant. August usage was forecasted to be 90 percent of capacity; actual usage was 87.6 percent of capacity. A smoothing constant of .1 is used. a. Prepare a forecast for September. b. Assuming actual September usage of 92 percent, prepare a forecast for October usage.arrow_forwardIn order to increase the responsiveness (volatility) of following forecast models, what can you do? Exponential Smoothing – describe in terms of “alpha value” (smoothing constant): Simple moving average - describe in terms of “averaging periods” (number of data points to use):arrow_forwardAn electrical contractor’s records during the last five weeks indicate the number of job requests:Week 1 2 3 4 5Requests 20 22 18 21 22 Predict the number of requests for week 6 using each of these methods:a. Naiveb. A four-period moving averagec. Exponential smoothing with α = .30; use 20 for week 2 forecastarrow_forward
 Contemporary MarketingMarketingISBN:9780357033777Author:Louis E. Boone, David L. KurtzPublisher:Cengage Learning
 MarketingMarketingISBN:9780357033791Author:Pride, William MPublisher:South Western Educational Publishing