
Concept explainers
Videos
Two independent methods of
a. Compute the MSE and MAD for each forecast. Does either forecast seem superior? Explain.
b. Compute MAPE for each forecast.
c. Prepare a naive forecast for periods 2 through 11 using the given sales data Compute each of the following: (1) MSE, (2) MAD, (3) tracking signal at month 10, and (4) 2s control limits How do the naive results compare with the other two forecasts?
a)
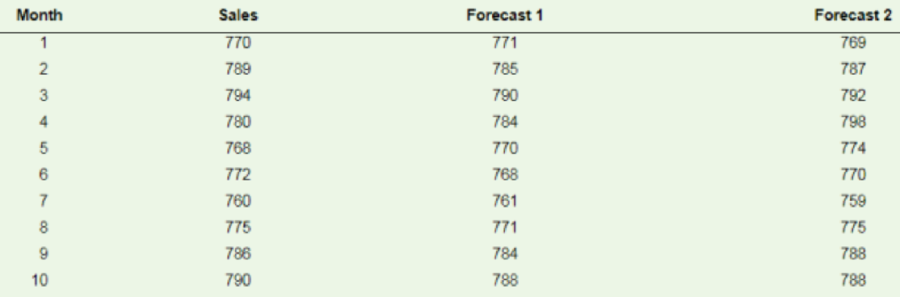
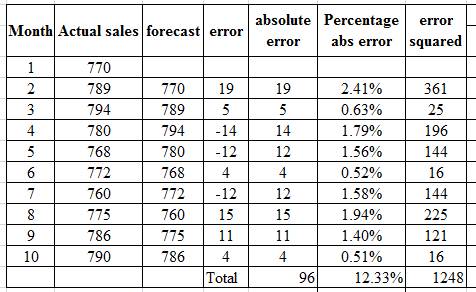
To compare: The MAD and MSE for two forecasts given below, including actual sales for 10 months.
Introduction: Mean Absolute Deviation (MAD) is the average distance between the data values and the mean. Mean Squared Error (MSE) is the average of the squares of the deviation and error.
Explanation of Solution
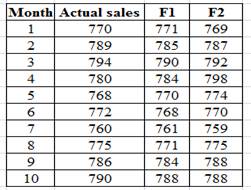
Given information:
Compute the MAD and MSE as shown below in the table:
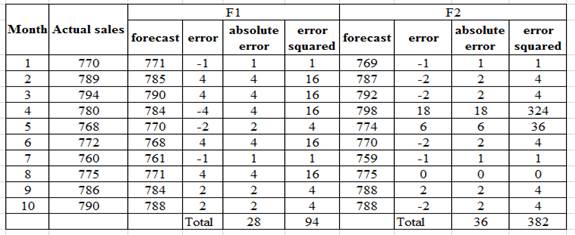
Compute the Mean absolute deviation (MAD) for the forecasting method F1 as shown below
Substitute the value of
Compute the Mean squared error (MSE) for the forecasting method F1 as shown below
Substitute the value of
Compute the Mean absolute deviation (MAD) for the forecasting method F2 as shown below
Substitute the value of
Compute the Mean squared error (MSE) for the forecasting method F2 as shown below
Substitute the value of
The first forecasting method F1 gives both a low value of MAD as well as MSE compared to the second forecasting method F2
b)
To compute: Mean Absolute Percentage Error for both the forecasts F1 and F2 as shown below.
Introduction: Forecasting is the planning process that helps to predict the future demand using present or past data. It uses certain assumptions based the knowledge and experience of the management.
Explanation of Solution
Determine MAPE for both the forecasts:
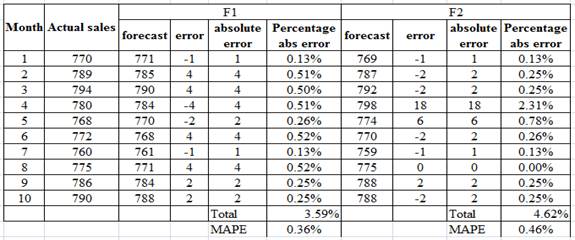
The Mean absolute percentage error is lower at 0.36% for the first forecasting method F1 compared to MAPE of 0.46% for the second forecasting method F2
c)
To prepare: A naïve forecast.
Introduction: Forecasting is the planning process that helps to predict the future demand using present or past data. It uses certain assumptions based the knowledge and experience of the management.
Explanation of Solution
Determine MAD and MSE using a naïve forecast:
Use the naïve method for forecasting as shown below.
(i)
Compute the Mean absolute deviation (MAD) for the naïve forecasting method as shown below
Substitute the value of
(ii)
Compute the Mean squared error (MSE) for the naïve forecasting method as shown below
Substitute the value of
(iii)
Compute the tracking signal on the 10th month as shown below.
First compute the cumulative forecast error (CFE) as shown below
12.49=
Compute the tracking signal (TS) by dividing the cumulative forecast error by MAD as shown below.
(iv)
Given the Mean Squared Error is 156, the standard deviation σ is 12.49
The two sigma control limits are +2×12.49=24.98 and -2×12.49=–24.98
Since the tracking signal 1.87 falls between +24.98 and –24.98, the forecasting process is in control
The comparison of the naïve method with the other two forecasting methods is shown below.
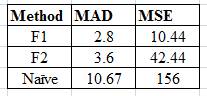
Obviously the naïve method compares very poorly with the other two methods F1 and F2, since both the Mean Absolute Deviation (MAD) and Mean Squared Error (MSE) are worse than the other two methods.
Want to see more full solutions like this?
Chapter 3 Solutions
Operations Management


- Under what conditions might a firm use multiple forecasting methods?arrow_forwardThe file P13_42.xlsx contains monthly data on consumer revolving credit (in millions of dollars) through credit unions. a. Use these data to forecast consumer revolving credit through credit unions for the next 12 months. Do it in two ways. First, fit an exponential trend to the series. Second, use Holts method with optimized smoothing constants. b. Which of these two methods appears to provide the best forecasts? Answer by comparing their MAPE values.arrow_forwardThe Baker Company wants to develop a budget to predict how overhead costs vary with activity levels. Management is trying to decide whether direct labor hours (DLH) or units produced is the better measure of activity for the firm. Monthly data for the preceding 24 months appear in the file P13_40.xlsx. Use regression analysis to determine which measure, DLH or Units (or both), should be used for the budget. How would the regression equation be used to obtain the budget for the firms overhead costs?arrow_forward
- The file P13_22.xlsx contains total monthly U.S. retail sales data. While holding out the final six months of observations for validation purposes, use the method of moving averages with a carefully chosen span to forecast U.S. retail sales in the next year. Comment on the performance of your model. What makes this time series more challenging to forecast?arrow_forwardThe owner of a restaurant in Bloomington, Indiana, has recorded sales data for the past 19 years. He has also recorded data on potentially relevant variables. The data are listed in the file P13_17.xlsx. a. Estimate a simple regression equation involving annual sales (the dependent variable) and the size of the population residing within 10 miles of the restaurant (the explanatory variable). Interpret R-square for this regression. b. Add another explanatory variableannual advertising expendituresto the regression equation in part a. Estimate and interpret this expanded equation. How does the R-square value for this multiple regression equation compare to that of the simple regression equation estimated in part a? Explain any difference between the two R-square values. How can you use the adjusted R-squares for a comparison of the two equations? c. Add one more explanatory variable to the multiple regression equation estimated in part b. In particular, estimate and interpret the coefficients of a multiple regression equation that includes the previous years advertising expenditure. How does the inclusion of this third explanatory variable affect the R-square, compared to the corresponding values for the equation of part b? Explain any changes in this value. What does the adjusted R-square for the new equation tell you?arrow_forwardThe file P13_29.xlsx contains monthly time series data for total U.S. retail sales of building materials (which includes retail sales of building materials, hardware and garden supply stores, and mobile home dealers). a. Is seasonality present in these data? If so, characterize the seasonality pattern. b. Use Winters method to forecast this series with smoothing constants = = 0.1 and = 0.3. Does the forecast series seem to track the seasonal pattern well? What are your forecasts for the next 12 months?arrow_forward
- The file P13_26.xlsx contains the monthly number of airline tickets sold by the CareFree Travel Agency. a. Create a time series chart of the data. Based on what you see, which of the exponential smoothing models do you think will provide the best forecasting model? Why? b. Use simple exponential smoothing to forecast these data, using a smoothing constant of 0.1. c. Repeat part b, but search for the smoothing constant that makes RMSE as small as possible. Does it make much of an improvement over the model in part b?arrow_forwardThe Hartley-Davis motorcycle dealer in the Minneapolis– St. Paul area wants to be able to forecast accurately the de-mand for the Roadhog Super motorcycle during the next month. From sales records, the dealer has accumulated thedata in the following table for the past year. a. Compute a three-month moving average forecast ofdemand for April through January (of the next year).b. Compute a five-month moving average forecast forJune through January.c. Compare the two forecasts computed in parts (a) and(b) using MAD. Which one should the dealer use forJanuary of the next year? Month Motorcycle SalesJanuary 9February 7March 10April 8May 7June 12July 10August 11September 12October 10November 14December 16arrow_forwardDaily high temperatures in St. Louis for the lastweek were as follows: 93, 94, 93, 95, 96, 88, 90 (yesterday).a) Forecast the high temperature today, using a 3-day movingaverage.b) Forecast the high temperature today, using a 2-day movingaverage.c) Calculate the mean absolute deviation based on a 2-daymoving average.d) Compute the mean squared error for the 2-day movingaverage.e) Calculate the mean absolute percent error for the 2-daymoving average.arrow_forward
- Corporate triple-A bond interest rates for 12 consecutive months follow. Month 1 2 3 4 5 6 7 8 9 10 11 12 Value 9.5 9.3 9.4 9.6 9.8 9.7 9.8 10.5 9.9 9.7 9.6 9.6 a. Construct a time series plot. What type of pattern exists in the data? b. Develop the three-month moving averages for this time series. Compute MSE. c. Compute MAE. d. Compute MAPE. e. What is the three-month moving average forecast for the next month (month 13)?arrow_forwardAt the ABC Floral Shop, an argument developed between two of the owners, Bob and Henry, over the accuracy of forecasting methods. Bob argued that exponential smoothing with α = .1 would be the best method. Henry argued that the shop would get a better forecast with α = .3.a. Using F1 = 100 and the data from problem 3, which of the two managers is right?b. Graph the two forecasts and the original data using Excel. What does the graph reveal?c. Maybe forecast accuracy could be improved. Try additional values of α = .2, .4, and .5 to see if better accuracy is achieved.arrow_forwardThe following tabulations are actual sales of units for six months and a starting forecast in January. ACTUAL FORECAST January 105 80 February 95 March 102 April 85 May 64 June 94 a. Calculate forecasts for the remaining five months using simple exponential smoothing with α = 0.2. b. Calculate the MAD for all the forecasts, including January's.arrow_forward
 Practical Management ScienceOperations ManagementISBN:9781337406659Author:WINSTON, Wayne L.Publisher:Cengage,
 Contemporary MarketingMarketingISBN:9780357033777Author:Louis E. Boone, David L. KurtzPublisher:Cengage Learning
 MarketingMarketingISBN:9780357033791Author:Pride, William MPublisher:South Western Educational Publishing