Marathon Times The following histogram of marathon times includes data for men and women and also for both an Olympic marathon and an amateur marathon. Greater values indicate slower runners. (Sources: www.forestcityroadraces.com and www.runnersworld.com) a. Describe the shape of the distribution. b. What are two different possible reasons for the two modes ? c. Knowing that there are usually fewer women who run marathons than men and that more people ran in the amateur marathon than in the Olympic marathon, look at the size of the mounds and try to decide which of the reasons stated in part b is likely to cause this. Explain.
Marathon Times The following histogram of marathon times includes data for men and women and also for both an Olympic marathon and an amateur marathon. Greater values indicate slower runners. (Sources: www.forestcityroadraces.com and www.runnersworld.com) a. Describe the shape of the distribution. b. What are two different possible reasons for the two modes ? c. Knowing that there are usually fewer women who run marathons than men and that more people ran in the amateur marathon than in the Olympic marathon, look at the size of the mounds and try to decide which of the reasons stated in part b is likely to cause this. Explain.
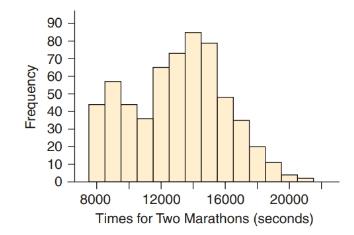
Solution Summary: The author explains that the histogram shows the distribution of marathon times for men and women for both an Olympic marathon and an amateur marathon.
Marathon Times The following histogram of marathon times includes data for men and women and also for both an Olympic marathon and an amateur marathon. Greater values indicate slower runners. (Sources: www.forestcityroadraces.com and www.runnersworld.com)
a. Describe the shape of the distribution.
b. What are two different possible reasons for the two modes?
c. Knowing that there are usually fewer women who run marathons than men and that more people ran in the amateur marathon than in the Olympic marathon, look at the size of the mounds and try to decide which of the reasons stated in part b is likely to cause this. Explain.
Definition Definition Measure of central tendency that is the value that occurs most frequently in a data set. A data set may have more than one mode if multiple categories repeat an equal number of times. For example, in a data set with five item—3, 5, 5, 29, 473—the mode is 5 because it occurs twice and no other value occurs more than once. On a histogram or bar chart, the element with the highest bar represents the mode. Therefore, the mode is sometimes considered the most popular option. The mode is useful for nominal or categorical data (e.g., the most common color car that users purchase), but it is problematic for continuous data because it is more likely not to have any value that is more frequent than the other.
Elementary Statistics: Picturing the World (6th Edition)
Knowledge Booster
Learn more about
Need a deep-dive on the concept behind this application? Look no further. Learn more about this topic, statistics and related others by exploring similar questions and additional content below.
How to make Frequency Distribution Table / Tally Marks and Frequency Distribution Table; Author: Reenu Math;https://www.youtube.com/watch?v=i_A6RiE8tLE;License: Standard YouTube License, CC-BY


 Glencoe Algebra 1, Student Edition, 9780079039897...AlgebraISBN:9780079039897Author:CarterPublisher:McGraw Hill
 Holt Mcdougal Larson Pre-algebra: Student Edition...AlgebraISBN:9780547587776Author:HOLT MCDOUGALPublisher:HOLT MCDOUGAL