
Concept explainers
Videos
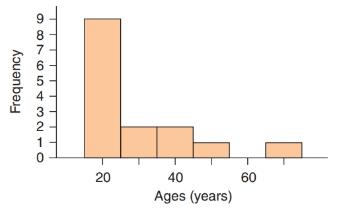
Students’ Ages Here are the ages of some students in a statistics class: 17, 19, 35, 18, 18, 20, 27, 25, 41, 21, 19, 19, 45, and 19. The teacher’s age is 66 and should be included as one of the ages when you do the calculations. The figure shows a histogram of the data.
a. Describe the distribution of ages by giving the shape, the numerical value for an appropriate measure of the center, and the numerical value for an appropriate measure of spread, as well as mentioning any outliers.
b. Make a rough sketch (or copy) of the histogram, and mark the approximate locations of the
Want to see the full answer?
Check out a sample textbook solution
Chapter 3 Solutions
Introductory Statistics
Additional Math Textbook Solutions
Statistics for Business and Economics (13th Edition)
Essentials of Statistics, Books a la Carte Edition (5th Edition)
Elementary Statistics ( 3rd International Edition ) Isbn:9781260092561
Statistics Through Applications


 Glencoe Algebra 1, Student Edition, 9780079039897...AlgebraISBN:9780079039897Author:CarterPublisher:McGraw Hill
 Holt Mcdougal Larson Pre-algebra: Student Edition...AlgebraISBN:9780547587776Author:HOLT MCDOUGALPublisher:HOLT MCDOUGAL
 Big Ideas Math A Bridge To Success Algebra 1: Stu...AlgebraISBN:9781680331141Author:HOUGHTON MIFFLIN HARCOURTPublisher:Houghton Mifflin Harcourt