
Relation between the inflation and the fund made up of precious metals.
Explanation of Solution
The precious metals include gold, silver, platinum, and others in the economy. The fund made up of these metals is traditionally known as the best measure against the inflation. If the assumption is true, there will be a strong positive relationship between the inflation rate and the demand for funds made up of precious metals. In order to see the relation between the two, the monthly
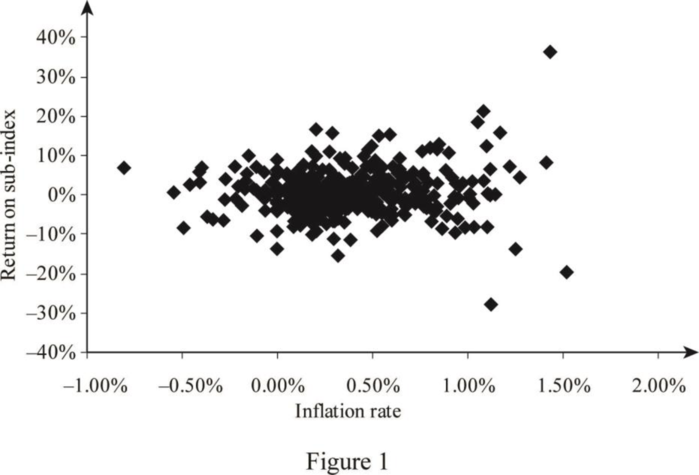
Through analyzing the pattern of the plots, it shows that there is no linear relationship identified between the inflation rate in the economy and the demand for the fund made up of precious metals.
Scatter diagram: The scatter diagram is a graphical representation of values of two variables plotted along the two axes. The pattern between the resulting plotted points reveals whether there is any relation between the two variables or not.
Want to see more full solutions like this?
Chapter 3 Solutions
Statistics for Management and Economics (Book Only)

- Please assist with the calculationarrow_forwardKk.355.arrow_forwardAn agent of a real state company stated that a house he sold in 1980 for $37000 was sold by the buyer for $90000 in 1990. If the increase in price is due to inflation, determine the average rate of inflation between 1980 and 1990.arrow_forward
- calculation reqarrow_forwardWhen is the indicator (consumer confidence index) released (date of release) and how is data collected?arrow_forwardIndicate if the following data sets represent time-series, cross section or panel data.a- Number of the registered students of the North Cyprus Universities between the years 1995 and 2016. ___________________b- Inflation rate of the EU members in 2020. ___________________c- FDI to Turkey between the years 1990 and 2016. ___________________d- Employment rate in Zimbabwe over the months from 2018 January to 2020 December. _________________2- Give the number of observations of the following data sets ?a- Inflation rate of the EU members in 2020. ___________________b- FDI to Turkey over the years from 1990 to 2016. ___________________c- Employment rate in Zimbabwe over the months from 2018 January to 2020 December. _________________arrow_forward
- Search for the “World Economic Outlook Database” on the internet and locate the most recent version. Use this database to select inflation data (units of percentage change) for Germany, Japan, and the United States for the period 1990 to 2010. Construct a table of annual inflation rates for these countries. Now construct a graph using annual inflation rates on the vertical axis and the year on the horizontal axis. Plot the annual inflation rates from your table in three separate lines on the same graph. How would you compare the experiences of these three countries based on your graph?arrow_forwardPlease show calculations with formula.arrow_forwardCalculate the rate of inflation or delation between 2014 and 2015.arrow_forward

 Principles of Economics (12th Edition)EconomicsISBN:9780134078779Author:Karl E. Case, Ray C. Fair, Sharon E. OsterPublisher:PEARSON
 Engineering Economy (17th Edition)EconomicsISBN:9780134870069Author:William G. Sullivan, Elin M. Wicks, C. Patrick KoellingPublisher:PEARSON
 Principles of Economics (MindTap Course List)EconomicsISBN:9781305585126Author:N. Gregory MankiwPublisher:Cengage Learning
 Managerial Economics: A Problem Solving ApproachEconomicsISBN:9781337106665Author:Luke M. Froeb, Brian T. McCann, Michael R. Ward, Mike ShorPublisher:Cengage Learning
 Managerial Economics & Business Strategy (Mcgraw-...EconomicsISBN:9781259290619Author:Michael Baye, Jeff PrincePublisher:McGraw-Hill Education