
Videos
Electronic devices contain electric circuits etched into wafers made of silicon. These silicon wafers are sealed with an ultrathin layer of silicon dioxide, in a process known as oxidation. This can be done with either new or recycled wafers.
In a study described in the book Statistical Case Studies for Industrial Process Improvement by V. Czitrom and P. Spagon, both new and recycled wafers were oxidized, and the thicknesses of the layers were measured to determine whether they tended to differ between the two types of wafers. Recycled wafers are cheaper than new wafer, so the hope was that they would perform at least as well as the new wafers. Following are 36 thickness measurements (in tenth s of a nanometer) for both new and recycled wafers.
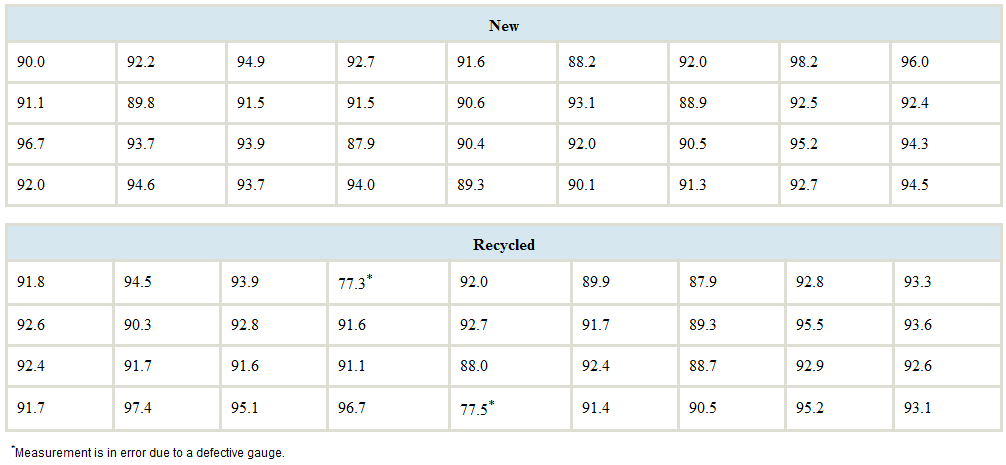
Suppose that it is desired to use the type of wafer whose distribution has less spread. Write a brief paragraph that explains which type of wafer to use and why. Which measure is more useful for spread in this case, the standard deviation or the
Want to see the full answer?
Check out a sample textbook solution
Chapter 3 Solutions
Connect Hosted by ALEKS Online Access for Elementary Statistics


- In the manufacturing of a chemical adhesive, 3% of all batches have raw materials from two different lots. This occurs when holding tanks are replenished and the remaining portion of a lot is insufficient to fill the tanks. Only 5% of batches with material from a single lot require reprocessing. However, the viscosity of batches consisting of two or more lots of material is more difficult to control, and 40% of such batches require additional processing to achieve the required viscosity. Let A denote the event that a batch is formed from two different lots, and let B denote the event that a lot requires additional processing. Determine the following probabilities: а. Р(А) e. P(ANB) f. P(ANB') g. P(B) b. P(А) С. Р[ВА) d. P(B|A')arrow_forwardAn investigation was conducted into the dust content in the flue gases of two types of solid-fuel boilers. Thirteen boilers of type A and nine boilers of type B were used under identical fueling and extraction conditions. Over a similar period, the quantities of dust were deposited in similar traps inserted in each of the twenty-two flues. Presented below are the collected dust content (in grams) given the source broiler type. Type A 73.1 56.4 82.1 67.2 78.7 75.1 48.0 53.3 55.5 61.5 60.6 55.2 63.1 Type B 53.0 39.3 55.8 58.8 41.2 66.6 46.0 56.4 58.9 questions are in inserted imagearrow_forwardTwo different analytical methods were used to determine residual chlorine in sewage effluents. Both methods were used on the same samples, but each sample came from various locations with differing amounts of contact time with the effluent. Two methods were used to determine the concentration of Cl in mg/L, and the results are shown in the following table: Sample Method A Method B 1 0.39 0.36 2 0.84 1.35 3 1.76 2.56 4 3.35 3.92 5 4.69 5.35 6 7.70 8.33 7 10.52 10.70 8 10.92 10.91 a) What type of t-test should be used to compare the two methods and why? b) Do the two methods give different results? State and test the appropriate hypotheses. c) Does the conclusion depend on whether the 90%, 95%, or 99% confidence levels are used?arrow_forward
- Inorganic phosphorous is a naturally occurring element in all plants and animals, with concentrations increasing progressively up the food chain (fruit < vegetables < cereals < nuts < corpse). Geochemical surveys take soil samples to determine phosphorous content (in ppm, parts per million). A high phosphorous content may or may not indicate an ancient burial site, food storage site, or even a garbage dump. Independent random samples from two regions gave the following phosphorous measurements (in ppm). Assume the distribution of phosphorous is mound-shaped and symmetric for these two regions. Region 1: x1;n1=15 857 1,551 1,230 875 1,080 2,330 1,850 1,860 2,340 1,080 910 1,130 1,450 1,260 1,010 region 11: x2;n2-14 538 812 790 1,230 1,770 960 1,650 860 890 640 1,180 1,160 1,050 1,020 (a)Use a calculator with mean and standard deviation keys to verify that x1, s1, x2, and s2. (Round your answers to four decimal places.) x1= ppm s1= ppm x2= ppm s2= ppm…arrow_forwardInorganic phosphorous is a naturally occurring element in all plants and animals, with concentrations increasing progressively up the food chain (fruit < vegetables < cereals < nuts < corpse). Geochemical surveys take soil samples to determine phosphorous content (in ppm, parts per million). A high phosphorous content may or may not indicate an ancient burial site, food storage site, or even a garbage dump. Independent random samples from two regions gave the following phosphorous measurements (in ppm). Assume the distribution of phosphorous is mound-shaped and symmetric for these two regions Region I: x1; n1 = 15 855 1550 1230 875 1080 2330 1850 1860 2340 1080 910 1130 1450 1260 1010 Region II: x2; n2 = 14 540 810 790 1230 1770 960 1650 860 890 640 1180 1160 1050 1020 (a) Use a calculator with mean and standard deviation keys to verify that x1, s1, x2, and s2. (Round your answers to one decimal place.) x1 = ppm s1 = ppm x2 = ppm s2 = ppm…arrow_forwardInorganic phosphorous is a naturally occurring element in all plants and animals, with concentrations increasing progressively up the food chain (fruit < vegetables < cereals < nuts < corpse). Geochemical surveys take soil samples to determine phosphorous content (in ppm, parts per million). A high phosphorous content may or may not indicate an ancient burial site, food storage site, or even a garbage dump. Independent random samples from two regions gave the following phosphorous measurements (in ppm). Assume the distribution of phosphorous is mound-shaped and symmetric for these two regions. Region I: x,; n, = 15 857 1,553 1,230 875 1,080 2,330 1,850 1,860 2,340 1,080 910 1,130 1,450 1,260 1,010 Region II: x2; n2 = 14 538 810 790 1,230 1,770 960 1,650 860 890 640 1,180 1,160 1,050 1,020 n USE SALT (a) Use a calculator with mean and standard deviation keys to verify that x,, s,, X2, and s,. (Round your answers to four decimal places.) X, = ppm S, = ppm X2 ppm S2 ppm %3D (b) Let u, be…arrow_forward
- Inorganic phosphorous is a naturally occurring element in all plants and animals, with concentrations increasing progressively up the food chain (fruit < vegetables < cereals < nuts < corpse). Geochemical surveys take soil samples to determine phosphorous content (in ppm, parts per million). A high phosphorous content may or may not indicate an ancient burial site, food storage site, or even a garbage dump. Independent random samples from two regions gave the following phosphorous measurements (in ppm). Assume the distribution of phosphorous is mound-shaped and symmetric for these two regions Region I: x1; n1 = 15 855 1550 1230 875 1080 2330 1850 1860 2340 1080 910 1130 1450 1260 1010 Region II: x2; n2 = 14 540 810 790 1230 1770 960 1650 860 890 640 1180 1160 1050 1020 (a) Use a calculator with mean and standard deviation keys to verify that x1, S1, X2, and s2. (Round your answers to one decimal place.) X1 ppm S1 = ppm X2 = ppm S2 = ppm (b) Let µ1 be the population mean for x1 and let…arrow_forwardInorganic phosphorous is a naturally occurring element in all plants and animals, with concentrations increasing progressively up the food chain (fruit < vegetables < cereals < nuts < corpse). Geochemical surveys take soil samples to determine phosphorous content (in ppm, parts per million). A high phosphorous content may or may not indicate an ancient burial site, food storage site, or even a garbage dump. Independent random samples from two regions gave the following phosphorous measurements (in ppm). Assume the distribution of phosphorous is mound-shaped and symmetric for these two regions. REGION I:X1;N1=15 857 1,551 1,230 875 1,080 2,330 1,850 1,860 2,340 1,080 910 1,130 1,450 1,260 1,010 REGION II:X2;N2=14 538 812 790 1,230 1,770 960 1,650 860 890 640 1,180 1,160 1,050 1,020 (a) Use a calculator with mean and standard deviation keys to verify that x1, s1, x2, and s2. (Round your answers to four decimal places.) x1= ppm s1= ppm x2= ppm s2= ppm…arrow_forwardInorganic phosphorous is a naturally occurring element in all plants and animals, with concentrations increasing progressively up the food chain (fruit < vegetables < cereals < nuts < corpse). Geochemical surveys take soil samples to determine phosphorous content (in ppm, parts per million). A high phosphorous content may or may not indicate an ancient burial site, food storage site, or even a garbage dump. Independent random samples from two regions gave the following phosphorous measurements (in ppm). Assume the distribution of phosphorous is mound-shaped and symmetric for these two regions. Region I: x1; n1 = 15 853 1,549 1,230 875 1,080 2,330 1,850 1,860 2,340 1,080 910 1,130 1,450 1,260 1,010 Region II: x2; n2 = 14 538 808 790 1,230 1,770 960 1,650 860 890 640 1,180 1,160 1,050 1,020 (a) Use a calculator with mean and standard deviation keys to verify that x1, s1, x2, and s2. (Round your answers to four decimal places.) x1= ppm s1= ppm x2= ppm s2=…arrow_forward
- Inorganic phosphorous is a naturally occurring element in all plants and animals, with concentrations increasing progressively up the food chain (fruit < vegetables < cereals < nuts < corpse). Geochemical surveys take soil samples to determine phosphorous content (in ppm, parts per million). A high phosphorous content may or may not indicate an ancient burial site, food storage site, or even a garbage dump. Independent random samples from two regions gave the following phosphorous measurements (in ppm). Assume the distribution of phosphorous is mound-shaped and symmetric for these two regions. Region I: x,; n, = 15 875 1,080 2,330 1,850 1,860 853 1,551 1,230 2,340 1,080 910 1,130 1,450 1,260 1,010 Region II: x,; n, = 14 540 808 790 1,230 1,770 960 1,650 860 890 640 1,180 1,160 1,050 | 1,020 In USE SALT (a) Use a calculator with mean and standard deviation keys to verify that x,, S,, x2, and s,. (Round your answers to four decimal places.) X1 ppm S. = ppm X2 ppm 52 ppm (b) Let u, be the…arrow_forwardInorganic phosphorous is a naturally occurring element in all plants and animals, with concentrations increasing progressively up the food chain (fruit < vegetables < cereals < nuts < corpse). Geochemical surveys take soil samples to determine phosphorous content (in ppm, parts per million). A high phosphorous content may or may not indicate an ancient burial site, food storage site, or even a garbage dump. Independent random samples from two regions gave the following phosphorous measurements (in ppm). Assume the distribution of phosphorous is mound-shaped and symmetric for these two regions Region I: x1; n1 = 15 855 1550 1230 875 1080 2330 1850 1860 2340 1080 910 1130 1450 1260 1010 Region II: x2; n2 = 14 540 810 790 1230 1770 960 1650 860 890 640 1180 1160 1050 1020 (a) Use a calculator with mean and standard deviation keys to verify that x1, s1, x2, and s2. (Round your answers to one decimal place.) x1 = ppm s1 = ppm x2 = ppm s2 = ppm…arrow_forwardInorganic phosphorous is a naturally occurring element in all plants and animals, with concentrations increasing progressively up the food chain (fruit < vegetables < cereals < nuts < corpse). Geochemical surveys take soil samples to determine phosphorous content (in ppm, parts per million). A high phosphorous content may or may not indicate an ancient burial site, food storage site, or even a garbage dump. Independent random samples from two regions gave the following phosphorous measurements (in ppm). Assume the distribution of phosphorous is mound-shaped and symmetric for these two regions. Region I: x1; n1 = 15 857 1,551 1,230 875 1,080 2,330 1,850 1,860 2,340 1,080 910 1,130 1,450 1,260 1,010 Region II: x2; n2 = 14 538 808 790 1,230 1,770 960 1,650 860 890 640 1,180 1,160 1,050 1,020 (a) Use a calculator with mean and standard deviation keys to verify that x1, s1, x2, and s2. (Round your answers to four decimal places.) x1= 1387.5333 ppm s1=…arrow_forward
 MATLAB: An Introduction with ApplicationsStatisticsISBN:9781119256830Author:Amos GilatPublisher:John Wiley & Sons Inc
 Probability and Statistics for Engineering and th...StatisticsISBN:9781305251809Author:Jay L. DevorePublisher:Cengage Learning
 Statistics for The Behavioral Sciences (MindTap C...StatisticsISBN:9781305504912Author:Frederick J Gravetter, Larry B. WallnauPublisher:Cengage Learning
 Elementary Statistics: Picturing the World (7th E...StatisticsISBN:9780134683416Author:Ron Larson, Betsy FarberPublisher:PEARSON
 The Basic Practice of StatisticsStatisticsISBN:9781319042578Author:David S. Moore, William I. Notz, Michael A. FlignerPublisher:W. H. Freeman
 Introduction to the Practice of StatisticsStatisticsISBN:9781319013387Author:David S. Moore, George P. McCabe, Bruce A. CraigPublisher:W. H. Freeman