
a.
The contrast expression for the comparison of tropical flowers.
a.
Answer to Problem 30.29E
The First hypothesis becomes:
The second hypothesis becomes:
The third Hypothesis becomes:
Explanation of Solution
Given info:
The data represents the comparisons of the tropical flowers. The variables are the lenghts aof bihai variety of Heliconia that is represented in two forms based on the color of caribaea variety.
Calculation:
In the ANOVA construction, the comparison of means
Group
The three hypotheses are terms of three contrasts are as follows:
The first hypothesis in terms of three contrasts is,
Thus, The First hypothesis becomes:
The second hypothesis in terms of three contrasts is,
Thus, The second hypothesis becomes:
The third hypothesis in terms of three contrasts is,
Thus, The third Hypothesis becomes:
b.
The null and alternative hypothesis and the sample contrast and also assess its statistical significance.
b.
Answer to Problem 30.29E
The First hypothesis becomes,
The second hypothesis becomes,
The third Hypothesis becomes,
The first sample contrast is,
The second sample contrast is,
The third sample contrast is,
The interpretation is that , there is a evidence that the mean bihai variety of Heliconia differs from the average of the two forms of Caribaea.
Explanation of Solution
Calculation:
In the ANOVA construction, the comparison of means
The sample contrast
Software procedure:
Step by step procedure to obtain two way ANOVA using the MINITAB software:
- Choose Stat > ANOVA > One-way.
- In Response, select the column of Length.
- In Factor, select the column of Variety
- Click on Comparison> Tick on Tukey under Comparison procedures assuming equal variances and then click OK.
- Click OK.
The Minitab output is shown below.
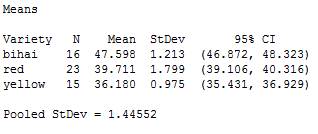
Fig (1)
From the Minitab result, the pooled standard deviation
The standard errors for the first sample contrast are,
Thus, The standard error for first sample contrast is 0.466.
Substitute
The standard error for second sample contrast is,
Thus, The standard error for the second sample contrast is 0.5617.
Substitute 0 for
The standard error for third sample contrast is,
Further, solve the above expression.
Thus, the standard error for third sample contrast is 0.4319.
Substitute
The hypotheses are given as:
The First hypothesis becomes:
The second hypothesis becomes:
The third Hypothesis becomes:
The t- statistics is,
The tabulated value with 51 degree of freedom is 1.6753 which is very much lesser than 68.2912. The null hypothesis is rejected for population contrast
There is evidence that the mean bihai variety of Heliconia differs from the average of the two forms of Caribaea.
c.
The 90% confidence interval for the population contrast.
c.
Answer to Problem 30.29E
The 90% confidence interval for
Explanation of Solution
Calculation:
The 90% confidence interval from the population contrast for the population contrast is calculated as:
The 90% confidence interval for
The lower limit is,
The upper limit is,
The 90% confidence interval is
Want to see more full solutions like this?
Chapter 30 Solutions
The Basic Practice of Statistics

 MATLAB: An Introduction with ApplicationsStatisticsISBN:9781119256830Author:Amos GilatPublisher:John Wiley & Sons Inc
 Probability and Statistics for Engineering and th...StatisticsISBN:9781305251809Author:Jay L. DevorePublisher:Cengage Learning
 Statistics for The Behavioral Sciences (MindTap C...StatisticsISBN:9781305504912Author:Frederick J Gravetter, Larry B. WallnauPublisher:Cengage Learning
 Elementary Statistics: Picturing the World (7th E...StatisticsISBN:9780134683416Author:Ron Larson, Betsy FarberPublisher:PEARSON
 The Basic Practice of StatisticsStatisticsISBN:9781319042578Author:David S. Moore, William I. Notz, Michael A. FlignerPublisher:W. H. Freeman
 Introduction to the Practice of StatisticsStatisticsISBN:9781319013387Author:David S. Moore, George P. McCabe, Bruce A. CraigPublisher:W. H. Freeman