
MyLab Economics with Pearson eText -- Access Card -- for Economics Today: The Micro View
19th Edition
ISBN: 9780134480336
Author: Roger LeRoy Miller
Publisher: PEARSON
expand_more
expand_more
format_list_bulleted
Videos
Textbook Question
Chapter 31, Problem 13P
Take a look at Figure 31-2. Suppose that initially society experiences a degree of air cleanliness that is lower than Q2 What would be true of the marginal benefit in relations to the marginal cost, and why would this fact induce society to increase the degree of air cleanliness toward Q2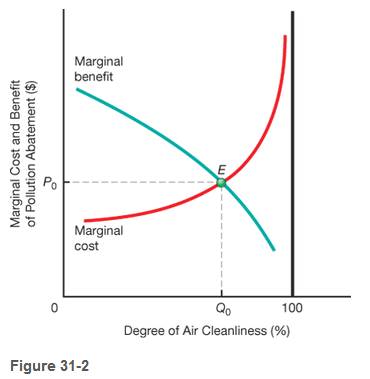
Expert Solution & Answer
Want to see the full answer?
Check out a sample textbook solution
Students have asked these similar questions
Consider regions A and B. In region A, the marginal benefit associated with pollution cleanup is MB = 300 – 10Q, while in region B, the marginal benefit associated with pollution cleanup is MB = 200 – 4Q. Suppose that the marginal cost of cleanup is constant at $12 per What is the optimal level of pollution cleanup in each of the two regions?
Refer to the figure above. A program that reduces emissions from the uncontrolled level of e1 to emissions level e2
Group of answer choices
A. reveals total costs equal to area (a+b+c+d)
B. is clearly preferable to e*, where MD=MAC
C. yields negative net benefits because the MD curve lies above the MAC curve
D. reveals net benefits of (a + b) – (b)
Suppose the marginal benefit (MB) and marginal cost (MC) curves for emitting particulate matter are given by the following schedules, where E is the quantity of emissions per period. The marginal benefits and costs are measured at the quantities of emissions shown.
E/Period
MB ($
MC ($)
0
230
0
200
190
10
400
150
30
600
110
50
800
70
70
1000
30
90
Use the information above to calculate the tax rate that would achieve the efficient rate of emissions.
Efficient Tax Rate =$__ per unit of pollution
Chapter 31 Solutions
MyLab Economics with Pearson eText -- Access Card -- for Economics Today: The Micro View
Ch. 31 - Prob. 31.1LOCh. 31 - Prob. 31.2LOCh. 31 - Prob. 31.3LOCh. 31 - Prob. 31.4LOCh. 31 - Prob. AFCTCh. 31 - Prob. BFCTCh. 31 - Prob. CFCTCh. 31 - Prob. 1CTQCh. 31 - Prob. 2CTQCh. 31 - What would be the appropriate change in the U. S...
Ch. 31 - Prob. 2FCTCh. 31 - Prob. 1PCh. 31 - Prob. 2PCh. 31 - Prob. 3PCh. 31 - Prob. 4PCh. 31 - Prob. 5PCh. 31 - Prob. 6PCh. 31 - Prob. 7PCh. 31 - Prob. 8PCh. 31 - Prob. 9PCh. 31 - Prob. 10PCh. 31 - Prob. 11PCh. 31 - Prob. 12PCh. 31 - Take a look at Figure 31-2. Suppose that initially...Ch. 31 - Prob. 14PCh. 31 - Prob. 15PCh. 31 - Prob. 16P
Knowledge Booster


Learn more about
Need a deep-dive on the concept behind this application? Look no further. Learn more about this topic, economics and related others by exploring similar questions and additional content below.Similar questions
- The perfectly competitive profit-maximizing firm in Exhibit 6 creates water and air pollution as a consequence of producing its output of pigs. If pollution costs are borne by third parties, the firm will maximize economic profit by choosing to a. voluntarily incur costs to reduce its pollution. b. produce at output rate Q3. c. produce at output rate Q2. d. produce at output rate Q4. EXHIBIT 6 Private and Social Costarrow_forwardFrom an economic viewpoint, the optimal amount of pollution a. is zero because all pollution imposes costs on society. b. is that amount firms create when they maximize economic profits by setting their marginal private costs equal to market price. c. is that amount where the marginal social costs of producing a good precisely equals the price of the good. d. Both answers b. and c. are correct.arrow_forward(Optimal Provision of Public Goods) Using at least two individual consumers, show how the market demand curve is derived from individual demand curves (a) for a private good and (b) for a public good. Once you have derived the market demand curve in each case, introduce a market supply curve and then show the optimal level of production.arrow_forward
- Economists sometimes shock noneconomists by stating that they do not favor the complete elimination of pollution. Explain the rationale for this position.arrow_forwardExplain how marketable emission credits add to overall economic efficiency, compared to across-the-board limitations on maximum discharges of air pollutants by firms.arrow_forwardIf the correct amount of pollution is being produced now, which of the following is true? The average cost of pollution: a. is exactly equal to the average cost of the pollution reduction.b. can be greater than, equal to, or less than the costs of pollution reduction.c. reduction is greater than the cost of the pollution at all levels of pollution.d. reduction is less than the cost of the pollution at all levels of pollution.arrow_forward
- Combating emissions that lead to global warming differs from other types of pollution abatement because the process of combating global warming is _____ cumulative. long run and short run and long run and not short run and notarrow_forwardFollowing are the marginal abatement costs of three firms . Suppose each firm is currently emitting 10 tons / week , so the total emissions are 30 tons / week . Suppose we wish to reduce total emissions by 50 % , to 15 tons per week . The following table provides marginal abatement costs for each firm . a ) What is the total cost if each firm cuts total emission by 50 % from their current levels . b ) What is the total cost if the total emissions decrease by 50 % ( to 15 tons per week ) that meets the equi - marginal principle . c ) From the society's point , which method of reducing ( a or b above ) emissions is better ? Provide a reason .arrow_forwardWhich of the following statements is TRUE about the optimal quantity of pollution? Question 6 options: irms should be allowed to determine the profit-maximizing amount of pollution abatement. Pollution abatement should continue up to the point where marginal cost equals the average total cost. Trade-offs exist between producing a cleaner environment and producing other goods and services. It equals zero.arrow_forward
- Consider the market for flu vaccines, in which consumption causes positive externalities by creating herd immunity. Quantity supplied is given by Qs=2+2*P Marginal Private Benefit (determines individual demand of consumers of the vaccine i.e. the benefit from not getting sick) is given by Qd=60.5-2.5*MBP. Marginal Social Costs (MPC plus the benefits of externalities) is given by Qd=69.5-2.5*MSB. Plot these 3 curves on a graph with 6 points at P=11,12,13,14,15,16. What is the deadweight loss if only free-market forces are at play (i.e. externalities are not considered by the consumers)? How much should the subsidy be to bring the market to efficient equilibrium?arrow_forwardSuppose there are two power plants that release sulfur dioxide (SO2) into air at their current production levels. Each firm currently emits 75 tons per year, thus emitting 150 tons total. Local authorities have decided they would like to reduce annual SO2 pollution to 100 tons per year (thus a 50 ton reduction). The power plants have different marginal abatement costs given by the following equations: MAC1 = 3q1 + 5 MAC2 = 2q2 (a) Suppose the local authorities decide to impose a uniform reduction of pollution by both power plants. In order to achieve the 50 unit reduction under this plan, both plants must reduce their emissions (abate pollution) by 25 units each. Find the total cost of abatement under this uniform reduction policy. (b) Find the efficient abatement amount for each power plant if you wanted to achieve the 50 unit reduction at the most cost-efficient way possible (i.e. find the q1 and q2 that achieves the 50 unit reduction in the cheapest way). What is the total cost of…arrow_forwardAssume citizens of Destrahan are complaining that Shell Chemical and Dow Chemical are polluting the environment. Currently, each firm emits 40 tons of pollution per year. Shell Chemical could reduce its pollution at a cost of $500 per ton, and Dow Chemical could reduce its pollution at a cost of $100 per ton. To reduce overall pollution to 40 units, the mayor gives each firm 20 tradable pollution permits. Each permit allows a firm to emit one ton of pollution. Assuming each permit has a market value is $200, what is the cost of reducing pollution to the desired level? a.$2,000 b.$4,000 c.$8,000 d.$10,000arrow_forward
arrow_back_ios
SEE MORE QUESTIONS
arrow_forward_ios
Recommended textbooks for you


 Economics (MindTap Course List)EconomicsISBN:9781337617383Author:Roger A. ArnoldPublisher:Cengage Learning

Economics (MindTap Course List)
Economics
ISBN:9781337617383
Author:Roger A. Arnold
Publisher:Cengage Learning
Environmental Law: The Clean Air Act; Author: LawShelf;https://www.youtube.com/watch?v=1-SH3kJpVA4;License: Standard Youtube License