
The control limits for
Answer to Problem 31.60E
The upper control limit and lower control limit for s are 847.136 and 821.864 respectively.
Explanation of Solution
Given info:
The 22 samples of three films each are measured at 10 minutes intervals. In samples 1 to 10, mistakes in operating the interferometer resulted in one high outlier thickness reading that was clearly incorrect.
Calculation:
Since the points for samples 1 and 10 lie above the upper control limit, thus the two values of s are to be removed that were out of control.
Thus the values for rest 20 samples are,
Since the total past samples are 20, thus the formula to calculate the mean is,
Thus, the overall mean of the sample means is,
The overall mean of the standard deviation is,
The formula to calculate the process standard deviation is,
Substitute 6.465 for
The formula to calculate the center line for s chart is,
Substitute 0.8862 for
The formula to calculate the upper control limit for an s chart is,
Substitute 2.276 for
Thus the UCL is 16.6038.
The formula to calculate the lower control limit for s chart is,
Substitute 0 for
Thus the LCL is 0.
Thus the center line and control limits for an s chart are 6.465, 16.6038 and 0 respectively.
The x axis of the s chart shows the sample and y axis shows standard deviation.’
Upper control limit is 16.6038.
Lower control limit is 0.
Centerline of the s chart is 6.465.
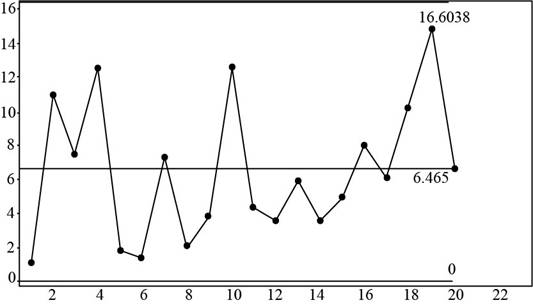
This shows that all the 20 samples are within the control limits, that is the data is in control.
The formula to calculate the center line for
Substitute 834.5 for
The formula to calculate the upper control limit for
Substitute 834.5 for
Thus the UCL is 847.136.
The formula to calculate the lower control limit for
Substitute 834.5 for
Thus the LCL is 821.864.
Thus the center line and control limits for an s chart are 834.5, 847.136 and 821.864 respectively.
The x axis of the
Upper control limit is 847.136.
Lower control limit is 821.864.
Centerline of the s chart is 834.5.
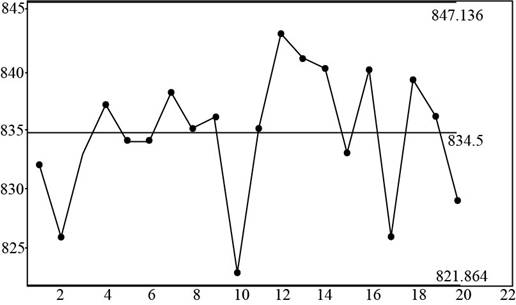
This shows that all the 20 samples are within the control limits, which are the data is in control.
Thus, s and
Want to see more full solutions like this?
Chapter 31 Solutions
Bundle: Basic Practice of Statistics 7e & LaunchPad (Twelve Month Access)

 MATLAB: An Introduction with ApplicationsStatisticsISBN:9781119256830Author:Amos GilatPublisher:John Wiley & Sons Inc
 Probability and Statistics for Engineering and th...StatisticsISBN:9781305251809Author:Jay L. DevorePublisher:Cengage Learning
 Statistics for The Behavioral Sciences (MindTap C...StatisticsISBN:9781305504912Author:Frederick J Gravetter, Larry B. WallnauPublisher:Cengage Learning
 Elementary Statistics: Picturing the World (7th E...StatisticsISBN:9780134683416Author:Ron Larson, Betsy FarberPublisher:PEARSON
 The Basic Practice of StatisticsStatisticsISBN:9781319042578Author:David S. Moore, William I. Notz, Michael A. FlignerPublisher:W. H. Freeman
 Introduction to the Practice of StatisticsStatisticsISBN:9781319013387Author:David S. Moore, George P. McCabe, Bruce A. CraigPublisher:W. H. Freeman