
To calculate: The control limits for s when removing sample 2 and 17. Also add the new control limits to the s chart.
To find: The control limits for
Answer to Problem 31.61E
For the s chart, the center line is 7.73, the lower control limit is 0 and the upper control limit is 19.85.
Output using the MINITAB software is given below:
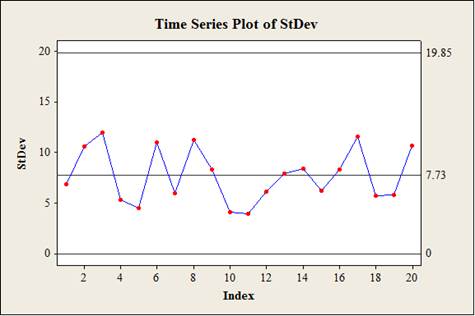
From the s charts, it can be observed that the process is within control.
For the
Output using the MINITAB software is given below:
From the
Explanation of Solution
Given info:
The data shows the mean and standard deviation for 22 samples of three films.
Calculation:
s chart:
Center line for an s chart:
The value of
Upper control limits:
Lower control limits:
Thus, the center line is 7.73, the lower control limit is 0, and the upper control limit is 19.85.
Software procedure:
Step-by-step procedure to construct s charts using the MINITAB software:
- Choose Graph > Time Series Plot or Stat > Time Series > Time Series Plot.
- Choose With Groups and click OK.
- In Series, select the column of standard deviation.
- In Show reference lines at Y values, enter 0, 7.73 and 19.85.
- Click OK.
Observation:
Since all observations lie within the lower and upper control limit, the s chart is within control.
Center line for a
The value of
Upper control limits:
Lower control limits:
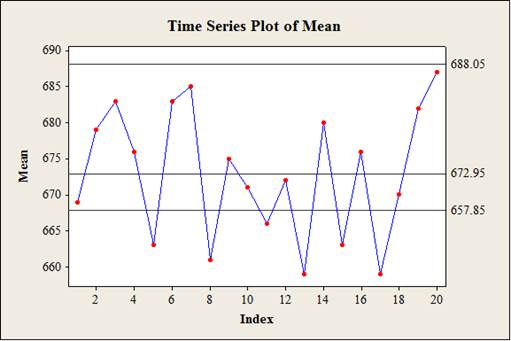
Thus, the center line is 672.95, the lower control limit is 657.85 and the upper control limit is 688.05.
Software procedure:
Step-by-step procedure to construct
- Choose Graph > Time Series Plot or Stat > Time Series > Time Series Plot.
- Choose With Groups and click OK.
- In Series, select the column of mean.
- In Show reference lines at Y values, enter 672.95, 657.85 and 688.05.
- Click OK.
Observation:
Since all the observations do not lie within the lower and upper control limit, the
Want to see more full solutions like this?
Chapter 31 Solutions
The Basic Practice of Statistics

 MATLAB: An Introduction with ApplicationsStatisticsISBN:9781119256830Author:Amos GilatPublisher:John Wiley & Sons Inc
 Probability and Statistics for Engineering and th...StatisticsISBN:9781305251809Author:Jay L. DevorePublisher:Cengage Learning
 Statistics for The Behavioral Sciences (MindTap C...StatisticsISBN:9781305504912Author:Frederick J Gravetter, Larry B. WallnauPublisher:Cengage Learning
 Elementary Statistics: Picturing the World (7th E...StatisticsISBN:9780134683416Author:Ron Larson, Betsy FarberPublisher:PEARSON
 The Basic Practice of StatisticsStatisticsISBN:9781319042578Author:David S. Moore, William I. Notz, Michael A. FlignerPublisher:W. H. Freeman
 Introduction to the Practice of StatisticsStatisticsISBN:9781319013387Author:David S. Moore, George P. McCabe, Bruce A. CraigPublisher:W. H. Freeman