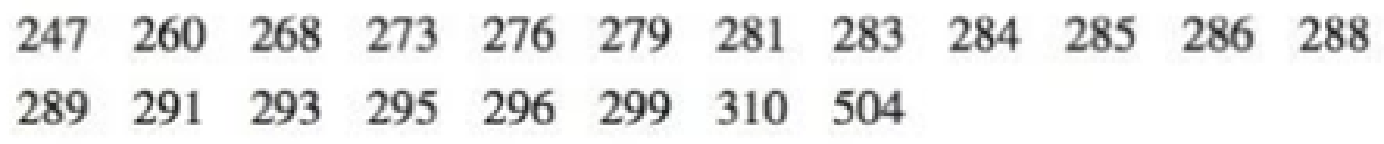
Trimmed Mean Because the mean is very sensitive to extreme values, we say that it is not a resistant measure of center. By deleting some low values and high values, the trimmed mean is more resistant. To find the 10% trimmed mean for a data set, first arrange the data in order, then delete the bottom 10% of the values and delete the top 10% of the values, then calculate the mean of the remaining values. Use the axial loads (pounds) of aluminum cans listed below (from Data Set 30 “Aluminum Cans” in Appendix B) for cans that are 0.0111 in. thick. An axial load is the force at which the top of a can collapses. Identify any outliers, then compare the median , mean, 10% trimmed mean, and 20% trimmed mean.
Trimmed Mean Because the mean is very sensitive to extreme values, we say that it is not a resistant measure of center. By deleting some low values and high values, the trimmed mean is more resistant. To find the 10% trimmed mean for a data set, first arrange the data in order, then delete the bottom 10% of the values and delete the top 10% of the values, then calculate the mean of the remaining values. Use the axial loads (pounds) of aluminum cans listed below (from Data Set 30 “Aluminum Cans” in Appendix B) for cans that are 0.0111 in. thick. An axial load is the force at which the top of a can collapses. Identify any outliers, then compare the median , mean, 10% trimmed mean, and 20% trimmed mean.
Solution Summary: The author explains that an observation is an outlier if it is far away from the usual pattern of the data.
Trimmed Mean Because the mean is very sensitive to extreme values, we say that it is not a resistant measure of center. By deleting some low values and high values, the trimmed mean is more resistant. To find the 10% trimmed mean for a data set, first arrange the data in order, then delete the bottom 10% of the values and delete the top 10% of the values, then calculate the mean of the remaining values. Use the axial loads (pounds) of aluminum cans listed below (from Data Set 30 “Aluminum Cans” in Appendix B) for cans that are 0.0111 in. thick. An axial load is the force at which the top of a can collapses. Identify any outliers, then compare the median, mean, 10% trimmed mean, and 20% trimmed mean.
Statistics that help describe, summarize, and present information extracted from data. Descriptive statistics include concepts related to measures of central tendency, measures of variability, measures of frequency, shape of distribution, and some data visualization techniques/tools such as pivot tables, charts, and graphs.
Need a deep-dive on the concept behind this application? Look no further. Learn more about this topic, statistics and related others by exploring similar questions and additional content below.
Hypothesis Testing using Confidence Interval Approach; Author: BUM2413 Applied Statistics UMP;https://www.youtube.com/watch?v=Hq1l3e9pLyY;License: Standard YouTube License, CC-BY
Hypothesis Testing - Difference of Two Means - Student's -Distribution & Normal Distribution; Author: The Organic Chemistry Tutor;https://www.youtube.com/watch?v=UcZwyzwWU7o;License: Standard Youtube License


 Glencoe Algebra 1, Student Edition, 9780079039897...AlgebraISBN:9780079039897Author:CarterPublisher:McGraw Hill
 Big Ideas Math A Bridge To Success Algebra 1: Stu...AlgebraISBN:9781680331141Author:HOUGHTON MIFFLIN HARCOURTPublisher:Houghton Mifflin Harcourt
 Functions and Change: A Modeling Approach to Coll...AlgebraISBN:9781337111348Author:Bruce Crauder, Benny Evans, Alan NoellPublisher:Cengage Learning
 Algebra: Structure And Method, Book 1AlgebraISBN:9780395977224Author:Richard G. Brown, Mary P. Dolciani, Robert H. Sorgenfrey, William L. ColePublisher:McDougal Littell
 College Algebra (MindTap Course List)AlgebraISBN:9781305652231Author:R. David Gustafson, Jeff HughesPublisher:Cengage Learning
 Holt Mcdougal Larson Pre-algebra: Student Edition...AlgebraISBN:9780547587776Author:HOLT MCDOUGALPublisher:HOLT MCDOUGAL