Concept explainers
Videos
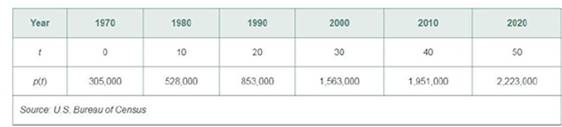
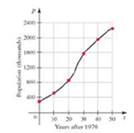
Population of Las Vegas Let p(t) represent the population of the Las Vegas metropolitan area t years after 1970 as shown in the table and figure.
a. Compute the average rate of growth of Las Vegas from 1970 to 1980.
b. Explain why the average rate of growth calculated in part(a) is a good estimate of the instantaneous rate of growth of Las Vegas in 1975.
c. Compute the average rate of growth of Las Vegas from 1970 to 2000. Is the average rate of growth an overestimate or an underestimate of the instantaneous rate of growth of Las Vegas in 2000? Approximate the growth rate in 2000.
Want to see the full answer?
Check out a sample textbook solution
Chapter 3 Solutions
Calculus: Early Transcendentals (3rd Edition)
Additional Math Textbook Solutions
University Calculus: Early Transcendentals (3rd Edition)
Precalculus Enhanced with Graphing Utilities (7th Edition)
University Calculus: Early Transcendentals (4th Edition)
Calculus, Single Variable: Early Transcendentals (3rd Edition)
Calculus: Early Transcendentals (2nd Edition)


- Continued This is a continuation of Exercise 13. As we saw earlier, the stock turnover rate of an item is the number of times that the average inventory of the item needs to be replaced as a result of sales in a given time period. Suppose that a hardware store sells 80 shovels each year. a. Suppose that the hardware store maintains an average inventory of 5 shovels. What is the annual stock turnover rate for the shovels? How is this related to the yearly number of orders to the wholesaler needed to restock inventory? b. What would he the annual stock turnover rate if the store maintained an average inventory of 20 shovels? c. Write a formula expressing the annual stock turnover rate as a function of the average inventory of shovels, identify the function and the variable, and state the units.arrow_forwardSales Growth In this exercise, we develop a model for the growth rate G, in thousands of dollars per year, in sales of the product as a function of the sales level s, in thousands of dollars. The model assumes that there is a limit to the total amount of sales that can be attained. In this situation, we use the term unattained sales for difference this limit and the current sales level. For example, if we expect sales grow to 3 thousand dollars in the long run, then 3-s is the unattained sales. The model states that the growth rate G is proportional to the product of the sales level s, and the unattained sales. Assume that the constant of proportionality is 0.3 and that the sales grow to 2 thousand dollars in the long run. a.Find the formula for unattained sales. b.Write an equation that shows the proportionality relation for G. c.On the basis of the equation from the part b, make a graph of G as a function of s. d.At what sales level is the growth rate as large as possible? e.What is the largest possible growth rate?arrow_forwardPopulation Growth and Decline The table gives the population in a small coastal community for the period 1997-2006. Figures shown arc for January 1 in each year. (a) What was the average rate of change of population between 1998 and 2001? (b) What was the average rate of change of population between 2002 and 2004? (C) For what period of lime was the population increasing? (d) For what period of time was the population decreasing?arrow_forward
 Algebra and Trigonometry (MindTap Course List)AlgebraISBN:9781305071742Author:James Stewart, Lothar Redlin, Saleem WatsonPublisher:Cengage Learning
 College AlgebraAlgebraISBN:9781305115545Author:James Stewart, Lothar Redlin, Saleem WatsonPublisher:Cengage Learning
 Functions and Change: A Modeling Approach to Coll...AlgebraISBN:9781337111348Author:Bruce Crauder, Benny Evans, Alan NoellPublisher:Cengage Learning
 Algebra & Trigonometry with Analytic GeometryAlgebraISBN:9781133382119Author:SwokowskiPublisher:Cengage