Concept explainers
Videos
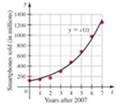
Smartphones From 2007 to 2014, there was a dramatic increase in smartphone sales The number of smartphones (in millions) sold to end users from 2007 to 2014 (see figure) is modeled by the function c(t) = 114.9e0.345t, where t represents the number of years after 2007.
a. Determine the average growth rate in smartphone sales between the years 2007 and 2009 and between 2012 and 2014. During which of these two time intervals was the growth rate greater?
b. Find the Instantaneous growth rate in smartphone sales at t = 1 (2008) and t = 6 (2013)? At which of these times was the instantaneous growth rate greater’
c. Use a graphing utility to graph the growth rate, for 0 ≤ t ≤ 7. What does the graph tell you about growth of smartphone sales to end users from 2007 to 2014?
Want to see the full answer?
Check out a sample textbook solution
Chapter 3 Solutions
Calculus: Early Transcendentals (3rd Edition)
Additional Math Textbook Solutions
University Calculus: Early Transcendentals (3rd Edition)
Calculus & Its Applications (14th Edition)
Precalculus (10th Edition)
Glencoe Math Accelerated, Student Edition
Thomas' Calculus: Early Transcendentals (14th Edition)


- What is the composition of two functions, fg ?arrow_forwardThe height h of a projectile is a function of the time t it is in die air. The height in feet for t seconds is given by the function h(t)=-16t2+96t . What is the domain of die function? What does the domain mean in the context of die problem?arrow_forwardGrazing Kangaroos The amount of vegetation eaten in a day by a grazing animal V of food available measured as biomass, in units such as pounds per acre. This relationship is called the functional response. If there is little vegetation available, the daily intake will be small, since the animal will have difficulty finding and eating the food. As the amount of food biomass increases, so does the daily intake. Clearly, though, there is a limit to the amount the animal will eat, regardless of the amount of food available. This maximum amount eaten is the satiation level. a.For the western grey kangaroo of Australia, the functional response is G=2.54.8e0.004V, where G=G(V) is the daily intake measured in pounds and V is the vegetation biomass measured in pounds per acre. i. Draw a graph of G against V. Include vegetation biomass levels up to 2000 pounds per acre. ii. Is the graph you found in part i concave up or concave down? Explain in practical terms what your answer means about how this kangaroo feeds. iii. There is a minimal vegetation biomass level below which the western grey kangaroo will eat nothing. Another way of expressing this is to say that the animal cannot reduce the food biomass below this level. Find this minimal level. iv. Find the satiation level for the western grey kangaroo. b. For the red kangaroo of Australia, the functional response is R=1.91.9e0.033V, Where R is the daily intake measured in pounds and V is the vegetation biomass measured in pounds per acre. i. Add the graph of R against V to the graph of G you drew in part a. ii. A simple measure of the grazing efficiency of an animal involves the minimal vegetation biomass level described above: The lower the minimal level for an animal, the more efficient it is at grazing. Which is more efficient at grazing, the western grey kangaroo or the red kangaroo?arrow_forward

 Big Ideas Math A Bridge To Success Algebra 1: Stu...AlgebraISBN:9781680331141Author:HOUGHTON MIFFLIN HARCOURTPublisher:Houghton Mifflin Harcourt
 Trigonometry (MindTap Course List)TrigonometryISBN:9781337278461Author:Ron LarsonPublisher:Cengage Learning
 Functions and Change: A Modeling Approach to Coll...AlgebraISBN:9781337111348Author:Bruce Crauder, Benny Evans, Alan NoellPublisher:Cengage Learning