Outliers and Trimmed Means. Some data sets contain outliers, observations that fall well outside the overall pattern of the data. (We discuss outliers in more detail in Section 3.4.) Suppose, for instance, that you are interested in the ability of high school algebra students to compute square roots. You decide to give a square-root exam to 10 of these students. Unfortunately, one of the students had a fight with his girlfriend and cannot concentrate—he gets a 0. The 10 scores are displayed in increasing order in the following table. The score of 0 is an outlier. Statisticians have a systematic method for avoiding extreme observations and outliers when they calculate means. They compute trimmed means, in which high and low observations are deleted or “trimmed off” before the mean is calculated. For instance, to compute the 10% trimmed mean of the test-score data, we first delete both the bottom 10% and the top 10% of the ordered data, that is, 0 and 80. Then we calculate the mean of the remaining data. Thus the 10% trimmed mean of the test-score data is 58 + 61 + 63 + 67 + 69 + 70 + 71 + 78 8 = 67.1 The following table displays a set of scores for a 40-question algebra final exam. a. Do any of the scores look like outliers? b. Compute the usual mean of the data. c. Compute the 5% trimmed mean of the data. d. Compute the 10% trimmed mean of the data. e. Compare the means you obtained in parts (b)–(d). Which of the three means provides the best measure of center for the data?
Outliers and Trimmed Means. Some data sets contain outliers, observations that fall well outside the overall pattern of the data. (We discuss outliers in more detail in Section 3.4.) Suppose, for instance, that you are interested in the ability of high school algebra students to compute square roots. You decide to give a square-root exam to 10 of these students. Unfortunately, one of the students had a fight with his girlfriend and cannot concentrate—he gets a 0. The 10 scores are displayed in increasing order in the following table. The score of 0 is an outlier. Statisticians have a systematic method for avoiding extreme observations and outliers when they calculate means. They compute trimmed means, in which high and low observations are deleted or “trimmed off” before the mean is calculated. For instance, to compute the 10% trimmed mean of the test-score data, we first delete both the bottom 10% and the top 10% of the ordered data, that is, 0 and 80. Then we calculate the mean of the remaining data. Thus the 10% trimmed mean of the test-score data is 58 + 61 + 63 + 67 + 69 + 70 + 71 + 78 8 = 67.1 The following table displays a set of scores for a 40-question algebra final exam. a. Do any of the scores look like outliers? b. Compute the usual mean of the data. c. Compute the 5% trimmed mean of the data. d. Compute the 10% trimmed mean of the data. e. Compare the means you obtained in parts (b)–(d). Which of the three means provides the best measure of center for the data?
Solution Summary: The author calculates the mean of the data set after removing smallest and largest observations.
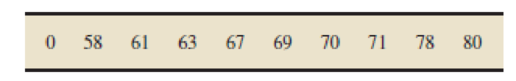
Outliers and Trimmed Means. Some data sets contain outliers, observations that fall well outside the overall pattern of the data. (We discuss outliers in more detail in Section 3.4.) Suppose, for instance, that you are interested in the ability of high school algebra students to compute square roots. You decide to give a square-root exam to 10 of these students. Unfortunately, one of the students had a fight with his girlfriend and cannot concentrate—he gets a 0. The 10 scores are displayed in increasing order in the following table. The score of 0 is an outlier.
Statisticians have a systematic method for avoiding extreme observations and outliers when they calculate means. They compute trimmed means, in which high and low observations are deleted or “trimmed off” before the mean is calculated. For instance, to compute the 10% trimmed mean of the test-score data, we first delete both the bottom 10% and the top 10% of the ordered data, that is, 0 and 80. Then we calculate the mean of the remaining data. Thus the 10% trimmed mean of the test-score data is
58
+
61
+
63
+
67
+
69
+
70
+
71
+
78
8
=
67.1
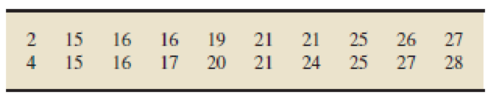
The following table displays a set of scores for a 40-question algebra final exam.
a. Do any of the scores look like outliers?
b. Compute the usual mean of the data.
c. Compute the 5% trimmed mean of the data.
d. Compute the 10% trimmed mean of the data.
e. Compare the means you obtained in parts (b)–(d). Which of the three means provides the best measure of center for the data?
Definition Definition Measure of central tendency that is the average of a given data set. The mean value is evaluated as the quotient of the sum of all observations by the sample size. The mean, in contrast to a median, is affected by extreme values. Very large or very small values can distract the mean from the center of the data. Arithmetic mean: The most common type of mean is the arithmetic mean. It is evaluated using the formula: μ = 1 N ∑ i = 1 N x i Other types of means are the geometric mean, logarithmic mean, and harmonic mean. Geometric mean: The nth root of the product of n observations from a data set is defined as the geometric mean of the set: G = x 1 x 2 ... x n n Logarithmic mean: The difference of the natural logarithms of the two numbers, divided by the difference between the numbers is the logarithmic mean of the two numbers. The logarithmic mean is used particularly in heat transfer and mass transfer. ln x 2 − ln x 1 x 2 − x 1 Harmonic mean: The inverse of the arithmetic mean of the inverses of all the numbers in a data set is the harmonic mean of the data. 1 1 x 1 + 1 x 2 + ...
Need a deep-dive on the concept behind this application? Look no further. Learn more about this topic, statistics and related others by exploring similar questions and additional content below.
Hypothesis Testing using Confidence Interval Approach; Author: BUM2413 Applied Statistics UMP;https://www.youtube.com/watch?v=Hq1l3e9pLyY;License: Standard YouTube License, CC-BY
Hypothesis Testing - Difference of Two Means - Student's -Distribution & Normal Distribution; Author: The Organic Chemistry Tutor;https://www.youtube.com/watch?v=UcZwyzwWU7o;License: Standard Youtube License


 Glencoe Algebra 1, Student Edition, 9780079039897...AlgebraISBN:9780079039897Author:CarterPublisher:McGraw Hill
 Big Ideas Math A Bridge To Success Algebra 1: Stu...AlgebraISBN:9781680331141Author:HOUGHTON MIFFLIN HARCOURTPublisher:Houghton Mifflin Harcourt
 Algebra & Trigonometry with Analytic GeometryAlgebraISBN:9781133382119Author:SwokowskiPublisher:Cengage
 Algebra: Structure And Method, Book 1AlgebraISBN:9780395977224Author:Richard G. Brown, Mary P. Dolciani, Robert H. Sorgenfrey, William L. ColePublisher:McDougal Littell
 Holt Mcdougal Larson Pre-algebra: Student Edition...AlgebraISBN:9780547587776Author:HOLT MCDOUGALPublisher:HOLT MCDOUGAL