
Videos
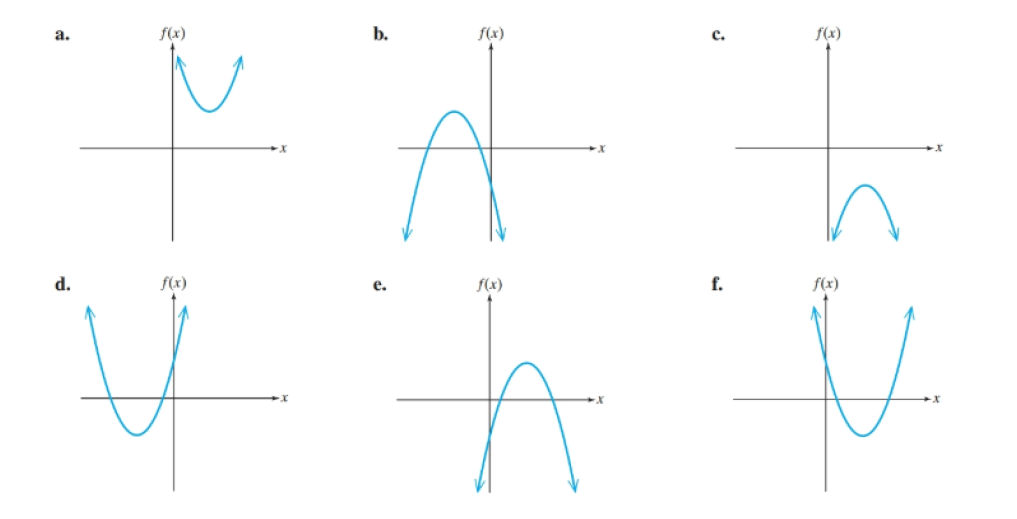
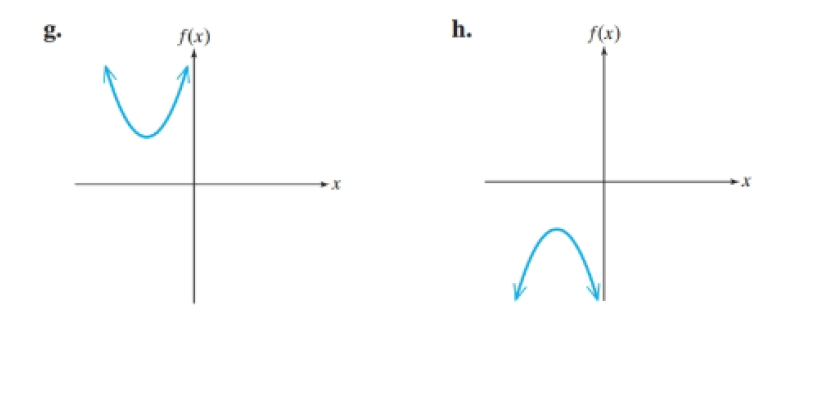
For Exercises 71–78, given a quadratic function defined by

Trending nowThis is a popular solution!

Chapter 3 Solutions
ALEKS 360 COLLLEGE ALGEBRA ACCESS


- In Exercises15–36, find the points of inflection and discuss theconcavity of the graph of the function. f(x)=\frac{6-x}{\sqrt{x}}arrow_forwardThe Mauna Loa Observatory in Hawaii records the carbon dioxide concentration y (in parts per million) in Earth’s atmosphere. The January readings for various years are shown in Figure . In the July 1990 issue of Scientific American, these data were used to predict the carbon dioxide level in Earth’s atmosphere in the year 2035, using the quadratic model y = 0.018t2 + 0.70t + 316.2 (Quadratic model for 1960–1990 data) where t = 0 represents 1960, as shown in Figure a. The data shown in figure b represent the years 1980 through 2014 and can be modeled by y = 0.014t2 + 0.66t + 320.3 (Quadratic model for 1980–2014) data where t = 0 represents 1960. What was the prediction given in the Scientific American article in 1990? Given the second model for 1980 through 2014, does this prediction for the year 2035 seem accurate?arrow_forwardIn Exercises 47–50, determine the x-intercepts of the graph of each quadratic function. Then match the function with its graph, labeled (a)-(d). Each graph is shown in a [-10, 10, 1] by [-10, 10, 1] viewing rectangle. 47. у 3D х2 -бх + 8 48. y = x? – 2r – 8 49. y = x² + 6x + 8 50. y = x² + 2x – 8 а. b. C. d.arrow_forward
- Write a function for the blue graph of a quadratic function in a form: f(x) = a (b (x + c))2 + d (1, 1). (0,0) 2 (0, –1) (-1, –3)arrow_forwardThe graph of a quadratic function f passes through the points (−2, 4), (1, 1) and (5, 0). What is the y-intercept of the graph of f?arrow_forwardFind expressions for the quadratic functions whose graphs are shown y (-2, 2), (0, 1) (4, 2) 3 (1,–2.5)arrow_forward
- The following graph shows the annual number of housing starts in a country during 2000–2008 together with the given quadratic approximating model. s(t) = −30t2 + 240t + 800 thousand homes per year (See attached graph) (t is the time in years since 2000.) At the same time, the homes being built were getting larger: The average area per home is approximately given by the following function. a(t) = 90t + 6,000 square feet Use the given models to estimate the total housing area under construction over the given period. (Use integration by parts to evaluate the integral, and round your answer to the nearest billion square feet.) HINT [Rate of change of area under construction = s(t)a(t).] ____________ billion square feetarrow_forwardfind the vertex for f (x) = x² – 6x + 13.arrow_forwardFind the quadratic function y = ax +bx+c whose graph passes through the given points %3D (-2,8), (1, – 4), (3,8) y =arrow_forward
- If(-5.2, g(x)) is a solution to the equation 5 – 3x=g(x), what is the value of g(x)?arrow_forwardFind the quadratic function satisfying the given conditions. The vertex is (6, –3), and one x-intercept is 4.arrow_forwardWrite the quadratic function in f(x) = a(x − h)2 + k form whose points on the graph are (-1,-5) and (0,-4)arrow_forward
 Algebra and Trigonometry (MindTap Course List)AlgebraISBN:9781305071742Author:James Stewart, Lothar Redlin, Saleem WatsonPublisher:Cengage Learning
 Algebra & Trigonometry with Analytic GeometryAlgebraISBN:9781133382119Author:SwokowskiPublisher:Cengage