Concept explainers
Videos
Solve each problem. See Example 6.
The table shows the rate (in percent) at which 2-year college students (public) completed a degree within 3 years.
| Year | Percent |
| 2008 | 29.3 |
| 2009 | 28.3 |
| 2010 | 28.0 |
| 2011 | 26.9 |
| 2012 | 25.4 |
| 2013 | 22.5 |
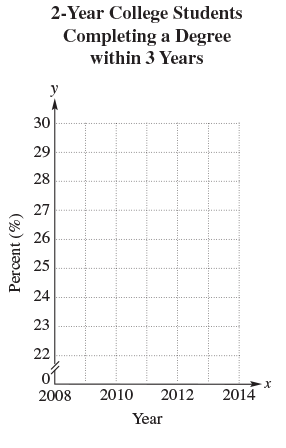
a. Write the data from the table as ordered pairs
b. What does the ordered pair
mean in the context of this problem?
c. Make a
d. Describe the pattern indicated by the points on the scatter diagram. What happened to the rates at which 2-year college students complete a degree within 3 years?
Want to see the full answer?
Check out a sample textbook solution
Chapter 3 Solutions
Beginning and Intermediate Algebra (6th Edition)


 Holt Mcdougal Larson Pre-algebra: Student Edition...AlgebraISBN:9780547587776Author:HOLT MCDOUGALPublisher:HOLT MCDOUGAL
 Glencoe Algebra 1, Student Edition, 9780079039897...AlgebraISBN:9780079039897Author:CarterPublisher:McGraw Hill
 Big Ideas Math A Bridge To Success Algebra 1: Stu...AlgebraISBN:9781680331141Author:HOUGHTON MIFFLIN HARCOURTPublisher:Houghton Mifflin Harcourt
 College Algebra (MindTap Course List)AlgebraISBN:9781305652231Author:R. David Gustafson, Jeff HughesPublisher:Cengage Learning