
Concept explainers
Videos
The bar graph Shows the ratings of American Idol from season 1 (2002) through season 12 (2013).
American Idol: Each Season’s Champion and Average Number of Viewers
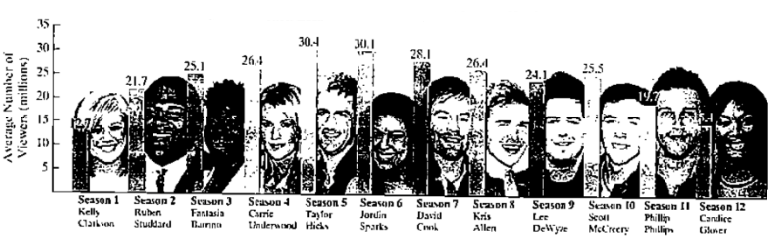
Source: Nielsen
a. Let x represent American Idol's season number and let y represent the average number of viewers, in millions. Use a graphing utility to draw a
b. Use the quadratic regression feature to find the quadratic function that best fits the data. Round all numbers to two decimal places.
c. Use the model in part (b) to determine the season in which American Idol had the greatest number of viewers. Round to the nearest whole number. According to the model, how many millions of viewers were there in that season? Round to one decimal place.
d. How do the results obtained from the model in part (c) compare with the data displayed by the graph?
e. Use a graphing utility to draw a scatter plot of the data and graph the quadratic function of best fit on the scatter plot. Can you see why projections based on the graph had the producers of American Idol looking for a shake-up? No shake-up was found and the show's final season aired in 2016.
Want to see the full answer?
Check out a sample textbook solution
Chapter 3 Solutions
Pearson eText College Algebra -- Instant Access (Pearson+)


- Does Table 2 represent a linear function? If so, finda linear equation that models the data.arrow_forwardPage of 11 ZOOM + 5. The table shows how the cost of a carne asada taco at my favorite taco stand has increased as they have become more popular since their opening in 2013. Use the data to answer the questions below. Year, x 2013, 0 2014, 1 2015, 2 2016, 3 2017, 4 2018, 5 2019,6 Cost ($) 0.50 0.55 0.65 0.75 0.90 1.00 1.10 (a) What is the regression line given by your TI-84 for this data? Round values to 3 decimal places. (b) Using the regression equation above, predict the cost of a carne asada taco at my favorite taco stand in 2020. Show the work.arrow_forwardThe table shows the lengths and weights of seven muskies captured by the Department of Natural Resources in Catfish Lake in Eagle River, Wisconsin. Use the linear regression feature on a graphing calculator to determine an equation of the line that best fits the data. Round to the hundredths. Musky 1 2 3 4 5 6 7 Length (in.) 26 27 29 33 35 36 38 Weight (lb) 5 8 9 12 14 14 19arrow_forward
- Use Excel Spreadsheets, Google Sheets, or GeoGebra to create a scatter plot for the data below. (You will upload your graph in the next question.) Use the graph to answer the questions below the table. The following data are the morning and evening high tide levels for Charleston, SC from January 1-14,2017. The information for the PM high tide for January 4 is missing. Create a scatter plot. Find the regression line and use it to estimate the PM high tide for January 4. Then find the correlation coefficient. (NOTE: The first column identifies the day. This data will not be used in the scatter plot.) Day AM High (in feet), xx PM High (in feet), yy 1 5.6 4.8 2 5.5 4.8 3 5.4 4.9 4 5.2 5 5.0 5.1 6 5.2 5.0 7 5.4 4.9 8 5.7 5.0 9 6.0 5.1 10 6.3 5.3 11 6.4 5.4 12 6.5 5.4 13 6.4 5.4 14 6.2 5.3 Source: SCDHEC.govarrow_forwardUse the given data to find the scatter plot, equation of the regression line, and prediction. 4) Managers rate employees according to job performance and attitude. The results for several randomly selected employees are given below. Performance 59 63 65 69 58 77 76 | 69 70 64 Attitude 72 67 78 82 75 87 92 83 87 78 What function do you use to see the scatterplot on the calculator. Scatterplot from the calculator:arrow_forwardWrite a multiple regression equation that can be used to analyze the data for a two-factorialdesign with two levels for factor A and three levels for factor B. Define all variables.arrow_forward
- A real estate agent has developed a linear model for the price of a house, P, in dollars in terms of the area, A, in square feet for the homes in a certain neighborhood. The data set had areas ranging from 1,000 square feet to 4,500 square feet. Would predicting the prices of a home that is 4,900 square feet be interpolation or extrapolation? Explain. Using the model to predict the price of a 4,900 square foot home is extrapolation because 4,900 square feet is outside the range of the areas in the data. Using the model to predict the price of a 4,900 square foot home is interpolation because 4,900 square feet is inside the range of the areas in the data. Using the model to predict the price of a 4,900 square foot home is extrapolation because 4,900 square feet is inside the range of the areas in the data. Using the model to predict the price of a 4,900 square foot home is interpolation because 4,900 square feet is outside the range of the areas in the data.arrow_forwardDraw a scatter diagram with square feet of living space as the independent variable and selling price as the dependent variable and describe variable and describe the relationship between the size of a house and the selling price.arrow_forwardAn analysis of the amount of fiber (in grams) and the potassium content (in milligrams) in servings of 77 breakfast cereals produced the regression model Potassium = 39+27Fiber. Explain what the slope means. Choose the correct answer below. C- OA. The model predicts that cereals will have approximately 27 more milligrams of potassium for every additional gram of fiber. OB. The model predicts that cereals will have approximately 27 more grams of fiber for every additional milligram of potassium. OC. The model predicts that cereals will have approximately 39 more grams of fiber for every additional milligram of potassium. OD. The model predicts that cereals will have approximately 39 more milligrams of potassium for every additional gram of fiber.arrow_forward
- Identify the type of data that would be used when the variable of interest is most-watched TV show.arrow_forwardThe following table shows the length, in centimeters, of the humerus and the total wingspan, in centimeters, of several pterosaurs, which are extinct flying reptiles.arrow_forwardFind a linear model for the data graphed in the scatter plot. y 60 50 40 30 20 10 1 3arrow_forward

 Glencoe Algebra 1, Student Edition, 9780079039897...AlgebraISBN:9780079039897Author:CarterPublisher:McGraw Hill
 Big Ideas Math A Bridge To Success Algebra 1: Stu...AlgebraISBN:9781680331141Author:HOUGHTON MIFFLIN HARCOURTPublisher:Houghton Mifflin Harcourt
 Algebra: Structure And Method, Book 1AlgebraISBN:9780395977224Author:Richard G. Brown, Mary P. Dolciani, Robert H. Sorgenfrey, William L. ColePublisher:McDougal Littell
 Holt Mcdougal Larson Pre-algebra: Student Edition...AlgebraISBN:9780547587776Author:HOLT MCDOUGALPublisher:HOLT MCDOUGAL