
Downward sloping of aggregate demand curve.
Explanation of Solution
The aggregate demand (AD) curve shows an inverse relation between price level and real GDP. As price level declines, purchases of real domestic output increases and vice-versa.
The aggregate demand curve slopes downward due to three reasons:
Real balance effect: A change in the price level produces the real balance effect. A rise in the price level, results in a decrease in the
Interest Rate Effect: Assuming the money supply in the economy to be fixed, rise in price level implies more money required for purchases and pay for inputs. So, an increase in money demanded would increase the price paid for it, that is. the interest rate. The rise in interest rate will increase the borrowing costs which decrease the investment expenditure. This will decrease the quantity of real output demanded, thus decreasing the aggregate demand.
Foreign Purchases Effect: It is one of the key reasons behind the sloping of the aggregate demand curve. When the domestic price level rises relative to foreign price levels, foreigners buy fewer domestic goods as it becomes more expensive and people (domestic) opt for more foreign goods. Therefore, the export of domestic goods decline and import of foreign goods rise. As a result, there will be a decline in the overall demand for our domestic output. Thus the aggregate quantity demanded of GDP will decline. This slopes the AD curve downwards.
The reasons for downward sloping of AD curve are different from the reason for downward sloping of demand curve of a single-product. Assuming, a constant money income, substitution effect can work on a single product, whereby dropping prices of a single product make it relatively cheaper product compared to the other products whose price have not been changed. Also, the consumer has become richer in real terms, as he could afford more of the product whose price has been declined. But with the AD curve, as all the prices are falling implies dropping of the price level, thus single product substitution effect is not applicable in AD curve. Also, while dealing with demand of a single product, money income is assumed to be fixed. But this assumption is not applicable in case of AD curve because with regard to the circular flow of the economy, lower prices indicate lower incomes. Thus a decline in the price level does not necessarily imply an increase in the nominal income of the economy as a whole since as prices are dropping, so are the receipts or revenue of the sellers.
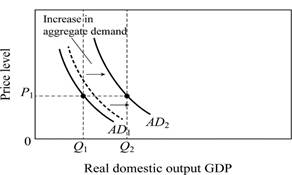
Figure-1
The multiplier effect acts on the initial change in spending to generate an even greater shift in the aggregate demand curve.
For instance, Figure 1 shows how multiplier effect works on an increase in income expenditure. The initial increase in spending is reflected by the broken line of AD curve, and then multiplier effect shift the AD curve from AD1 to AD2.
Concept Introduction:
Aggregate Demand: It refers to the total value of the goods and services available for purchase at a particular price in a given period of time.
Multiplier effect: Multiplier refers to the ratio of change in the real GDP to the change in initial consumption at constant price rate. Multiplier is positively related to the marginal propensity to consumer and negatively related with the marginal propensity to save.
Want to see more full solutions like this?
Chapter 32 Solutions
Economics (Irwin Economics)

- Given the following information about each economy , either calculate the missing variable or determine that it cannot be calculated . [LO 7.2,7.3] a. If C=\$20.1 billion, I=\$3.5 billion G=\$5.2 billion, and NX=-\$1 billion, what is total income ? b. If total income is $1 trillion G=\$0.3 tr trillion , and C=\$0.5 trillion , what is I? c. If total expenditure is $675 billion, C=\$433 billion , I = $105 billion , and G=\$75 billion , what is NX ? How much are exports ? How much are imports?arrow_forwardSuppose that consumer spending initially rises by $5 billion for every 1 percent rise in household wealth and that investment spending initially rises by $20 billion for every 1 percentage point fall in the real interest rate. Also assume that the economy’s multiplier is 4. a. If household wealth falls by 5 percent because of declining house values, and the real interest rate falls by 3 percentage points, in what direction and by how much will the aggregate demand curve initially shift at each price level?arrow_forwardCrusoe will live this period and the next period as the lone inhabitant of his island. His only income is a crop of 100 coconuts that he harvests at the begin- ning of each period. Coconuts not consumed in the current period spoil at the rate of 10 percent per period. (LO5) a. Draw Crusoe’s intertemporal budget constraint. What will be his consump- tion in each period if he regards future consumption as a perfect, one-for- one substitute for current consumption? b. What will he consume each period if he regards 0.8 unit of future consump- tion as being worth 1 unit of current consumption?arrow_forward
- For the linear IS-LM model, the goods market and the money market are in equilibrium when. Suppose that the economy is characterized by the following equations: (Y;r) = ( 1200 ; 6), Y-C-IG=0, C-Co-c(Y-T)=0,I-Io+hr=0, and kY-ur-M^s=0, which are satisfied for Co=60, lo=150, G=250, T=200, M^s=60, with the parameters c=0.8, k=0.1, h=10, and u=10. How are the equilibrium and affected, a) if "h" (the sensivity of the demand for investment to the interest rate) decreases to 5? b) if "u" (the sensitivity of the demand for real money balances to the interest rate) decreases to 5?arrow_forward(a) Suppose the price level in an economy rises while the money wage rate remains constant. What happens to the quantity of real GDP supplied. How will this affect the aggregate supply or aggregate demand curve? What if the potential GDP increases? Which aggregate curve is affected and how? (b) Real GDP Consumption Planned Investment Government Purchases Net Exports $1,000 $1,000 $100 $150 -$50 2,000 1,900 100 150 -50 3,000 2,800 100 150 -50 4,000 3,700 100 150 -50 From the table data provided, answer the following questions. The numbers in the table are in billions of dollars. Show all calculations. a. What is the equilibrium level of real GDP? b. What is the Marginal Propensity to Consume? c. What is the multiplier value in this economy? d. If potential GDP is $4,000 billion, is the economy at full employment? If not, what is the condition of the economy? e. If the economy is…arrow_forward8. Suppose the computer industry receives an initial extra income for $100. Think about the multiplier process in the first round. I). How much more income will the wire industry receive in the first round? O. $20 O. $25 O. $45 O. $55 ii). How much income will local workers receive? O. $20 O. $25 O. $45 O. $55arrow_forward
- Suppose that a hypothetical economy has the following relationship between its real output and the input quantities necessary for producing that output: a. What is productivity in this economy?b. What is the per-unit cost of production if the price of each input unit is $2?c. Assume that the input price increases from $2 to $3 with no accompanying change in productivity. What is the new per-unit cost of production? In what direction would the $1 increase in input price push the economy’s aggregate supply curve? What effect would this shift of aggregate supply have on the price level and the level of real output?d. Suppose that the increase in input price does not occur but, instead, that productivity increases by 100 percent. What would be the new per-unit cost of production? What effect would this change in per-unit production cost have on the economy’s aggregate supply curve? What effect would this shift of aggregate supply have on the price level and the level of real output?arrow_forward7 Suppose that the government increases its expenditure on goods and services by $100 billion and pays for these goods and services by raising autonomous taxes by $100 billion. What is the effect on aggregate demand and real GDP of each change individually and of the two combinedarrow_forward9. True or false? If the statement is false, explain why: LO4 a. An internally held public debt is like a debt of the left hand owed to the right hand. b. The Federal Reserve and federal government agencies hold more than half the public debt. c. As a percentage of GDP, the federal debt held by the public was smaller in 2010 than it was in 1990. d. As a percentage of GDP, the total U.S. public debt is the highest such debt among the world’s advanced industrial nations.arrow_forward
- Suppose that the aggregate demand and aggregate supply schedules for a hypothetical economy are as shown below: a. Use these sets of data to graph the aggregate demand and aggregate supply curves. What is the equilibrium price level and the equilibrium level of real output in this hypothetical economy? Is the equilibrium real output also necessarily the full-employment real output? Explain.b. Why will a price level of 150 not be an equilibrium price level in this economy? Why not 250?c. Suppose that buyers desire to purchase $200 billion of extra real output at each price level. Sketch in the new aggregate demand curve as AD1. What factors might cause this change in aggregate demand? What is the new equilibrium price level and level of real output?arrow_forwardDiscuss how decisions by consumers (householders) and firms can shift the AD curve left or right. Holding AS constant, explain how this will tend to change the equilibrium price level and real GDP produced in the economy. Lastly, how could the government play a role in helping the economy recover from a recession in this model? (11.4)arrow_forward

 Principles of Economics (12th Edition)EconomicsISBN:9780134078779Author:Karl E. Case, Ray C. Fair, Sharon E. OsterPublisher:PEARSON
 Engineering Economy (17th Edition)EconomicsISBN:9780134870069Author:William G. Sullivan, Elin M. Wicks, C. Patrick KoellingPublisher:PEARSON
 Principles of Economics (MindTap Course List)EconomicsISBN:9781305585126Author:N. Gregory MankiwPublisher:Cengage Learning
 Managerial Economics: A Problem Solving ApproachEconomicsISBN:9781337106665Author:Luke M. Froeb, Brian T. McCann, Michael R. Ward, Mike ShorPublisher:Cengage Learning
 Managerial Economics & Business Strategy (Mcgraw-...EconomicsISBN:9781259290619Author:Michael Baye, Jeff PrincePublisher:McGraw-Hill Education