
a)
The graph of aggregate demand and
a)
Explanation of Solution
The graph of aggregate demand and aggregate supply that shows an economy in long-run macroeconomic equilibrium would be drawn as follows:
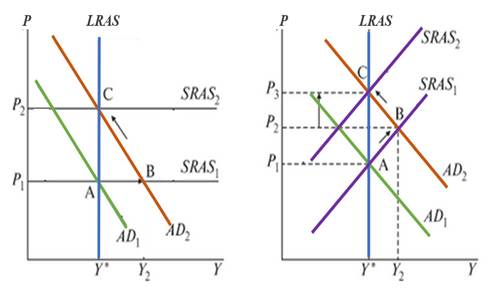
When total demand and total supply are equal in the economy, then there is macroeconomic equilibrium. Long-term changes in aggregate demand only have an impact on changes in the equilibrium price level and have no impact on equilibrium production.
Introduction: At the point where the aggregate demand curve and the
b)
What happens on the graph in the short run when the central bank increases the money supply to pay off a government deficit.
b)
Explanation of Solution
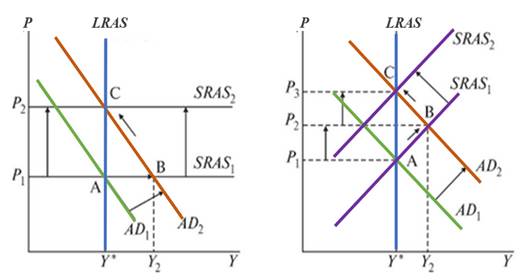
If the aggregate supply curve is horizontal in the short term, an increase in aggregate demand just causes the equilibrium output Y* and Y* to increase to the points Y2 Y2, without any change in the price level.
Moreover, a rise in aggregate demand leads to an increase in the equilibrium output value which is increased on the graph from points Y* and Y* to points Y2 and Y2 the equilibrium price level. Therefore, when the central bank increases the money supply to pay off a government deficit
then the short-run aggregate supply curve has a positive slope.
Introduction: At the point where the aggregate demand curve and the aggregate supply curve connect, macroeconomic equilibrium takes place when the amount of real GDP requested and supplied is equal.
c)
What happens in the long run on the graph?
c)
Explanation of Solution
In the long run, production and employment are unaffected by changes in aggregate demand over and only price changes have an impact due to the increase in money supply to pay for the deficit. Price is increased from P2 to P3 due to the increase in aggregate demand in the long run.
Introduction: At the point where the aggregate demand curve and the aggregate supply curve connect, macroeconomic equilibrium takes place when the amount of real GDP requested and supplied is equal.
Chapter 32 Solutions
Krugman's Economics For The Ap® Course


 Principles of Economics (12th Edition)EconomicsISBN:9780134078779Author:Karl E. Case, Ray C. Fair, Sharon E. OsterPublisher:PEARSON
 Engineering Economy (17th Edition)EconomicsISBN:9780134870069Author:William G. Sullivan, Elin M. Wicks, C. Patrick KoellingPublisher:PEARSON
 Principles of Economics (MindTap Course List)EconomicsISBN:9781305585126Author:N. Gregory MankiwPublisher:Cengage Learning
 Managerial Economics: A Problem Solving ApproachEconomicsISBN:9781337106665Author:Luke M. Froeb, Brian T. McCann, Michael R. Ward, Mike ShorPublisher:Cengage Learning
 Managerial Economics & Business Strategy (Mcgraw-...EconomicsISBN:9781259290619Author:Michael Baye, Jeff PrincePublisher:McGraw-Hill Education