Concept explainers
Videos
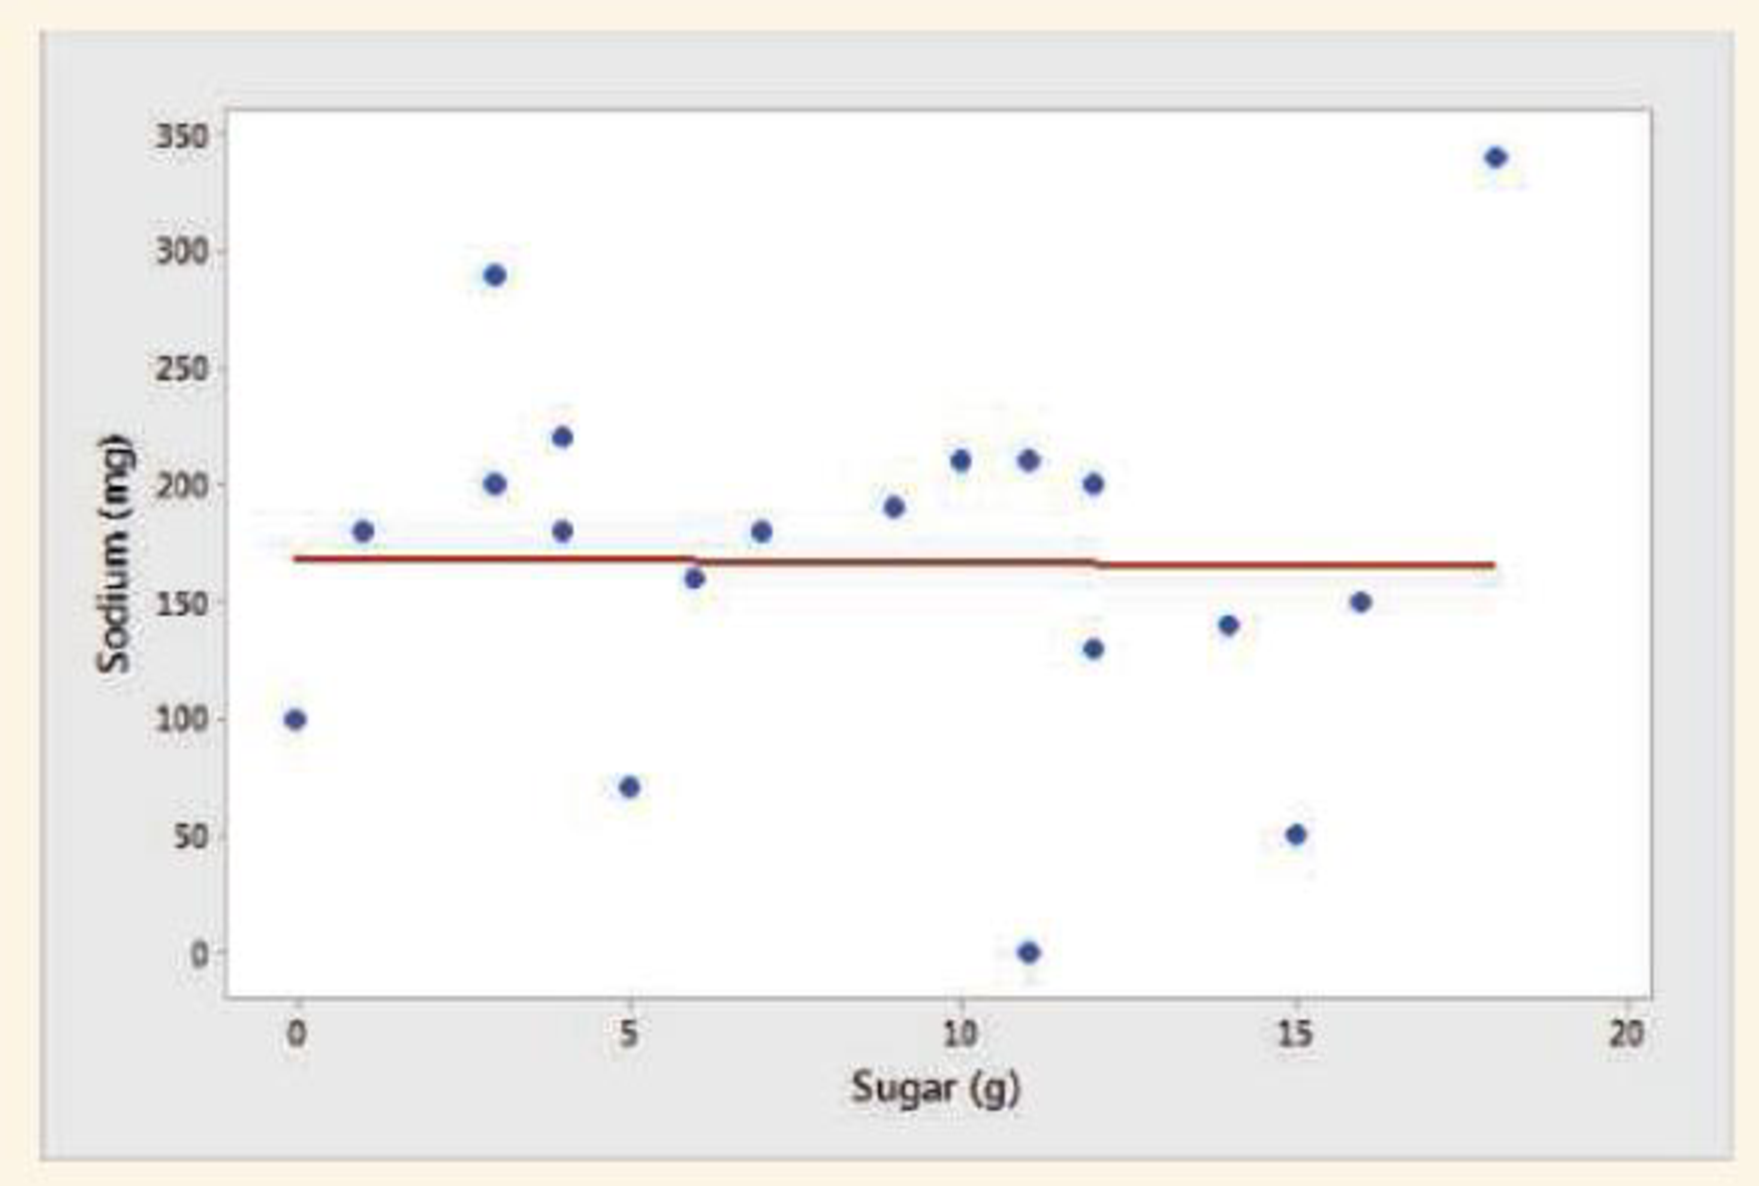
Regression between cereal sodium and sugar The following figure shows the result of a
a. What criterion is used in finding the line?
b. Can you draw a line that will result in a smaller sum of the squared residuals?
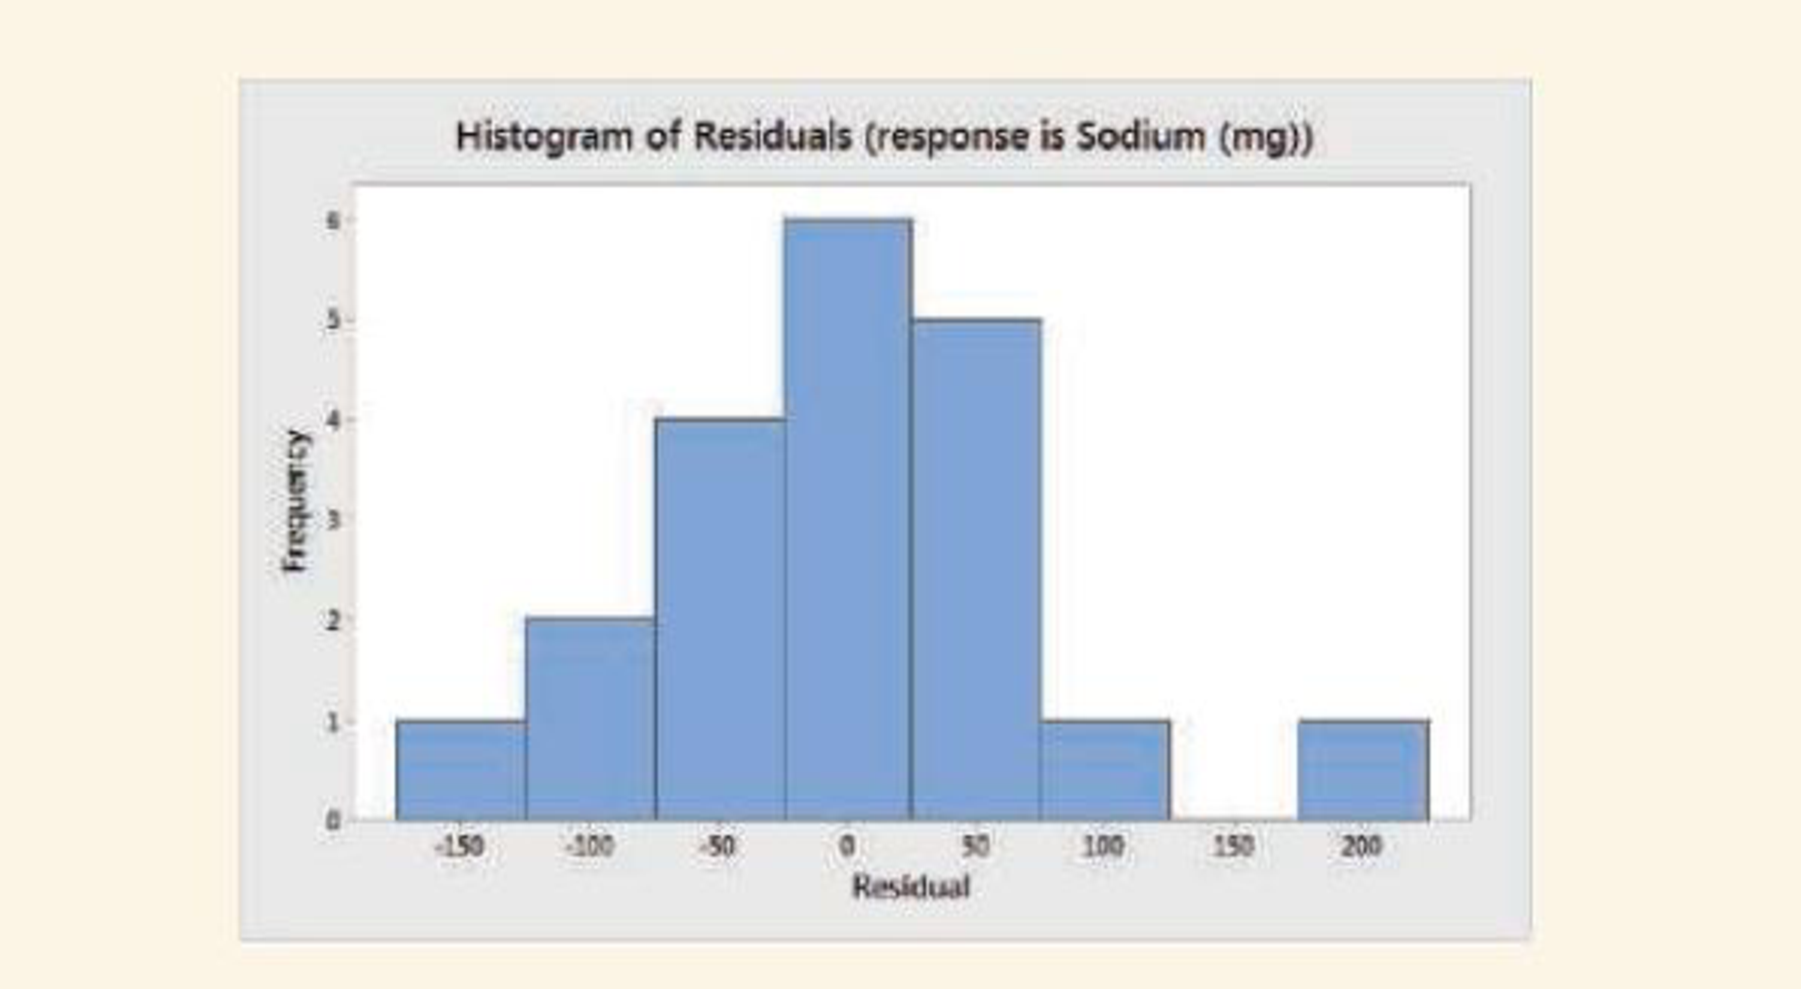
c. Now let’s look at a histogram of the residuals. Explain what the two short bars on the far right of the histogram mean in the context of the problem. Which two brands of cereal do they represent? Can you find them on the
d. In general, how reliable would you say amount of sugar is as a predictor of the amount of sodium?
Want to see the full answer?
Check out a sample textbook solution
Chapter 3 Solutions
EBK STATISTICS


- Find the equation of the regression line for the following data set. x 1 2 3 y 0 3 4arrow_forwardFor the following table of data. x 1 2 3 4 5 6 7 8 9 10 y 0 0.5 1 2 2.5 3 3 4 4.5 5 a. draw a scatterplot. b. calculate the correlation coefficient. c. calculate the least squares line and graph it on the scatterplot. d. predict the y value when x is 11.arrow_forward
 Functions and Change: A Modeling Approach to Coll...AlgebraISBN:9781337111348Author:Bruce Crauder, Benny Evans, Alan NoellPublisher:Cengage Learning
 Calculus For The Life SciencesCalculusISBN:9780321964038Author:GREENWELL, Raymond N., RITCHEY, Nathan P., Lial, Margaret L.Publisher:Pearson Addison Wesley,
 Glencoe Algebra 1, Student Edition, 9780079039897...AlgebraISBN:9780079039897Author:CarterPublisher:McGraw Hill
 Algebra & Trigonometry with Analytic GeometryAlgebraISBN:9781133382119Author:SwokowskiPublisher:Cengage
 Big Ideas Math A Bridge To Success Algebra 1: Stu...AlgebraISBN:9781680331141Author:HOUGHTON MIFFLIN HARCOURTPublisher:Houghton Mifflin Harcourt