Videos
Obesity Obesity (BMI ≥ 30) increases the risk of diabetes, heart disease, and many other ailments. The percent of Americans who are obese from 2000 projected to 2030 is shown in the table below.
a. Graph the data points to determine whether a quadratic function is a reasonable model for the data.
b. If it is reasonable, find the quadratic function that models obesity, with x equal to the number of years after 2000 and y equal to the percent of obese Americans. Report the model with three significant digits.
c. Use the unrounded model to predict the percent with obesity in 2023.
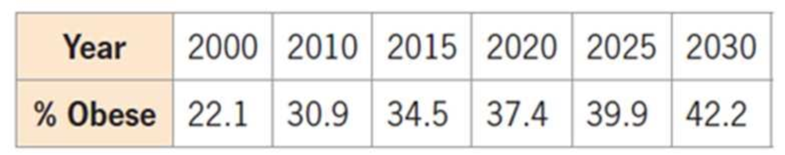
(Source: American Journal of Preventive Medicine)
Want to see the full answer?
Check out a sample textbook solution
Chapter 3 Solutions
MyLab Math with Pearson eText plus Worksheets for College Algebra in Context with Integrated Review -- Access Card Package (5th Edition)


- Given information about the graph of a quadratic function, find its equation. Vertex (2,0) and point on graph (4,12).arrow_forwardA company determines that its weekly profit from manufacturing and selling x units of a certain item is given by Px=-x3+3x2+2880x-500. Use a graphing utility to find the weekly production rate that will maximize the profit.arrow_forwardHow can you use the discriminant when you are graphing a quadratic function?arrow_forward
 Algebra for College StudentsAlgebraISBN:9781285195780Author:Jerome E. Kaufmann, Karen L. SchwittersPublisher:Cengage Learning
 College Algebra (MindTap Course List)AlgebraISBN:9781305652231Author:R. David Gustafson, Jeff HughesPublisher:Cengage Learning
 Big Ideas Math A Bridge To Success Algebra 1: Stu...AlgebraISBN:9781680331141Author:HOUGHTON MIFFLIN HARCOURTPublisher:Houghton Mifflin Harcourt
 Algebra: Structure And Method, Book 1AlgebraISBN:9780395977224Author:Richard G. Brown, Mary P. Dolciani, Robert H. Sorgenfrey, William L. ColePublisher:McDougal Littell
 Glencoe Algebra 1, Student Edition, 9780079039897...AlgebraISBN:9780079039897Author:CarterPublisher:McGraw Hill