
Videos
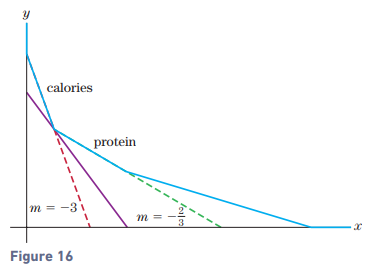
Figure 16 shows the feasible set for the nutrition problem discussed in Example 1 of Section 3.3, along with the purple line of final cost passing through the optimal point. The figure shows that, as long as the slope of the final cost line is between -3 and – 2 3, the optimal solution will still be at the same vertex.
(a) Suppose that the cost of a cup of rice is changed from
(b) Show that, when
(c) Use similar reasoning to show that the range of optimality for the cost of a cup of soybeans is
Want to see the full answer?
Check out a sample textbook solution
Chapter 3 Solutions
Finite Mathematics & Its Applications (12th Edition)


 Linear Algebra: A Modern IntroductionAlgebraISBN:9781285463247Author:David PoolePublisher:Cengage Learning
 Algebra & Trigonometry with Analytic GeometryAlgebraISBN:9781133382119Author:SwokowskiPublisher:Cengage
 College Algebra (MindTap Course List)AlgebraISBN:9781305652231Author:R. David Gustafson, Jeff HughesPublisher:Cengage Learning