
STATISTICS F/BUSINESS+ECONOMICS-TEXT
13th Edition
ISBN: 9781305881884
Author: Anderson
Publisher: CENGAGE L
expand_more
expand_more
format_list_bulleted
Videos
Textbook Question
Chapter 3.4, Problem 51E
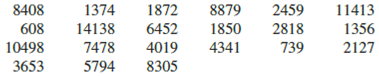
Annual sales, in millions of dollars, for 21 pharmaceutical companies follow.
- a. Provide a five-number summary.
- b. Compute the lower and upper limits.
- c. Do the data contain any outliers?
- d. Johnson & Johnson’s sales are the largest on the list at $14,138 million. Suppose a data entry error (a transposition) had been made and the sales had been entered as $41,138 million. Would the method of detecting outliers in part (c) identify this problem and allow for correction of the data entry error?
- e. Show a box plot.
Expert Solution & Answer

Trending nowThis is a popular solution!

Students have asked these similar questions
Professor Moore is interested in examining the commute times of her students to class.. Here is a sample of daily commute times (in minutes) of 42 students.
24
30
20
60
15
25
15
25
34
12
25
5
25
35
40
20
17
30
25
25
25
20
45
15
30
6
4
4
25
20
15
15
3
20
10
15
15
10
7
18
22
6
A. Are there any outliers? Show your calculations.
39 students were asked their political orientation and to estimate the number of people making up the US Congress. 16 students identified themselves as conservative, 16 as moderate and 7 as liberal. The following 16 data values represent the estimates of the size of the US Congress for the 16 conservative students.
68
100
162
180
210
230
250
250
260
300
330
440
480
535
535
656
Q1 = 195 and Q3 = 460.
1. For determining outliers, we create an interval to check if all our data is in that interval. What would be the lower endpoint of this interval? ["", "", "", "", ""] AC 0 -125.5 25 68 -202.5
2. For determining outliers, we create an interval to check if all our data is in that interval. What would be the upper endpoint of this interval? ["", "", "", "", ""] AC 857.5 750.5 656 1000 700
3. Finally, what would be our conclusion regarding if there exist any outliers in this data? AC 68 is the only outlier as…
You are interested in how many contacts older adults have in their smartphones. Here are data on the number of contacts for a random sample of 30 elderly adults with smartphones in a large city.
7 20 24 25 25 28 28 30 32 35 42 43 44 45 46 47 48 48 50 51 72 75 77 78 79 83 87 88 135 151
Are there any outliers? Enter the boundary for low and high outliers below, then determine if the data set has any outliers. Do not round the boundary values.
Chapter 3 Solutions
STATISTICS F/BUSINESS+ECONOMICS-TEXT
Ch. 3.1 - Consider a sample with data values of 10, 20, 12,...Ch. 3.1 - Consider a sample with data values of 10, 20, 21,...Ch. 3.1 - Consider the following data and corresponding...Ch. 3.1 - Consider the following data. Period Rate of Return...Ch. 3.1 - Consider a sample with data values of 27, 25, 20,...Ch. 3.1 - Consider a sample with data values of 53, 55, 70,...Ch. 3.1 - The average number of minutes Americans commute to...Ch. 3.1 - The Wall Street Journal reported that the median...Ch. 3.1 - Which companies spend the most money on...Ch. 3.1 - Over a nine-month period, OutdoorGearLab tested...
Ch. 3.1 - According to the National Education Association...Ch. 3.1 - The Big Bang Theory, a situation comedy featuring...Ch. 3.1 - In automobile mileage and gasoline-consumption...Ch. 3.1 - The data contained in the file named StateUnemp...Ch. 3.1 - Martinez Auto Supplies has retail stores located...Ch. 3.1 - The grade point average for college students is...Ch. 3.1 - The following table shows the total return and the...Ch. 3.1 - Based on a survey of masters programs in business...Ch. 3.1 - Annual revenue for Corning Supplies grew by 5.5%...Ch. 3.1 - Suppose that at the beginning of 2004 you invested...Ch. 3.1 - If an asset declines in value from 5000 to 3500...Ch. 3.1 - The current value of a company is 25 million. If...Ch. 3.2 - Consider a sample with data values of 10, 20, 12,...Ch. 3.2 - Consider a sample with data values of 10, 20, 12,...Ch. 3.2 - Consider a sample with data values of 27, 25, 20,...Ch. 3.2 - Data collected by the Oil Price information...Ch. 3.2 - The results of a search to find the least...Ch. 3.2 - The Australian Open is the first of the four grand...Ch. 3.2 - The Los Angeles times regularly reports the air...Ch. 3.2 - The following data were used to construct the...Ch. 3.2 - The results of Accounting Principals latest...Ch. 3.2 - Advertising age annually compiles a list of the...Ch. 3.2 - Scores turned in by an amateur golfer at the...Ch. 3.2 - The following times were recorded by the...Ch. 3.3 - Consider a sample with data values of 10, 20, 12,...Ch. 3.3 - Consider a sample with a mean of 500 and a...Ch. 3.3 - Consider a sample with a mean of 30 and a standard...Ch. 3.3 - Suppose the data have a bell-shaped distribution...Ch. 3.3 - The results of a national survey showed that on...Ch. 3.3 - The energy information Administration reported...Ch. 3.3 - The Graduate Management Admission Test (GMAT) is a...Ch. 3.3 - Many families in California are using backyard...Ch. 3.3 - According to a Los Angeles Times study of more...Ch. 3.3 - A sample of 10 NCAA college basketball game scores...Ch. 3.3 - The Wall Street Journal reported that Walmart...Ch. 3.4 - Consider a sample with data values of 27, 25, 20,...Ch. 3.4 - Prob. 47ECh. 3.4 - Prob. 48ECh. 3.4 - A data set has a first quartile of 42 and a third...Ch. 3.4 - Naples, Florida, hosts a half-marathon (13.1-mile...Ch. 3.4 - Annual sales, in millions of dollars, for 21...Ch. 3.4 - Consumer Reports provided overall customer...Ch. 3.4 - Fortune magazines list of the worlds most admired...Ch. 3.4 - The Bureau of Transportation Statistics keeps...Ch. 3.5 - Five observations taken for two variables follow....Ch. 3.5 - Five observations taken for two variables follow....Ch. 3.5 - Ten major college football bowl games were played...Ch. 3.5 - A department of transportations study on driving...Ch. 3.5 - Over the past 40 years, the percentage of homes in...Ch. 3.5 - The Russell 1000 is a stock market index...Ch. 3.5 - A random sample of 30 colleges from Kiplingers...Ch. 3 - The average number of times Americans dine out in...Ch. 3 - USA Today reports that NCAA colleges and...Ch. 3 - The average waiting time for a patient at an El...Ch. 3 - U.S. companies lose 63.2 billion per year from...Ch. 3 - A study of smartphone users shows that 68% of...Ch. 3 - Public transportation and the automobile are two...Ch. 3 - In 2007 the New York Times reported that the...Ch. 3 - The data contained in the DATAfile named...Ch. 3 - Travel + Leisure magazine provides an annual list...Ch. 3 - The 32 teams in the National Football League (NFL)...Ch. 3 - Does a major league baseball teams record during...Ch. 3 - The days to maturity for a sample of five money...Ch. 3 - Automobiles traveling on a road with a posted...Ch. 3 - The Panama Railroad Company was established in...Ch. 3 - Pelican Stores Pelican Stores, a division of...Ch. 3 - Motion Picture Industry The motion picture...Ch. 3 - Business Schools of Asia-Pacific The pursuit of a...Ch. 3 - African Elephant Populations Although millions of...
Knowledge Booster


Learn more about
Need a deep-dive on the concept behind this application? Look no further. Learn more about this topic, statistics and related others by exploring similar questions and additional content below.Similar questions
- Refer the given table below and identify the indicator that can be used to detect outlier from multiple variables? Also, identify and report how many respondents have outliers in the given table? Respondents Mahalanobis Distance Value Mahalanobis Chi- Square Significance Z-Score Value Mean Value 80 75.159 0.0001 3.24 2.083 339 74.737 0.0042 3.29 2.681 82 73.711 0.0012 4.56 3.452 278 73.429 0.0201 2.98 5.698 172 71.093 0.0003 -3.29 6.321 35 69.442 0.0128 6.32 2.314arrow_forwardIdentify all possible outliers from the following data set:0.145.24.756.1517.23.97.8arrow_forwardThe following data set is about the number of times a sample of 20 families dined out last week: 6 1 5 3 7 3 0 3 1 3 4 1 2 4 1 0 5 6 3 1 Compute Z score for each number. Do the data contain outliers?arrow_forward
- The bookstore at IRSC would like to estimate the proportion of students who prefer electronic textbooks (eBooks) over printed textbooks (hard copies). A random sample of 30 students was surveyed. Their preferences are listed below. hard copy hard copy hard copy eBook eBook eBook hard copy eBook hard copy eBook hard copy hard copy hard copy hard copy hard copy hard copy hard copy hard copy hard copy hard copy hard copy hard copy hard copy hard copy hard copy hard copy hard copy hard copy hard copy hard copy Determine the point estimate, p^ and the sample standard deviation, sˆp^. Round the sample proportion to four decimal places and round the standard deviation to six decimal places, if necessary p^= s with the p^= Using a 96% confidence level, determine the margin of error, E, and a confidence interval for the proportion of all students at the college who work prefer eBooks over printed textbooks. Report the confidence interval using interval…arrow_forwardThe ages of 14 members of a track and field team are given below. Using this data, complete the following steps: a. Determine the quarries and obtain the five-number summary for the given data. b. Find the interquartile rage. c. Calculate the lower and upper limits and identify potential outliers d. Construct a modified boxplot. 22,24,17,24,25,42,26,24,18,27,25,19,23,26arrow_forwardThe following data represent salaries, in thousands of dollars, for employees of a small company. Find and state the five number summary, and use it to determine if any values are outliers. 24 25 25 27 27 29 30 35 35 35 36 38 38 39 39 40 40 40 45 45 45 45 47 52 52 52 58 59 59 61 61 67 68 68 68 250arrow_forward
- Given the following dataset, calculate the upper cutoff for outliers. A: 110, 210, 389, 465, 890, 1000, 1101, 1238.arrow_forwardA mining company finds that daily lost-work injuries averages to 1.2. If the local union contract has a clause requiring that the mine be shut down as soon as three workers incur lost-work injuries, on what percentage of the days will the mine be operational throughout the day?arrow_forwardThe commute times (in minutes) of 30 employees are listed below 31 41 45 48 52 55 56 55 63 65 67 67 69 70 70 74 75 78 79 79 80 81 83 85 85 87 90 92 95 99 a) what is the lower bound? b) what is the lower bound? c) Are there any outliers and explain whyarrow_forward
- The bookstore at IRSC would like to estimate the proportion of students who prefer electronic textbooks (eBooks) over printed textbooks (hard copies). A random sample of 30 students was surveyed. Their preferences are listed below. hard copy hard copy hard copy hard copy eBook hard copy hard copy hard copy hard copy hard copy hard copy hard copy hard copy hard copy hard copy hard copy hard copy hard copy hard copy hard copy eBook eBookeBook hard copy hard copy hard copy hard copy hard copyhard copy hard copy Determine the point estimate, and the sample standard deviation, hat p; s hat p Round the sample proportion to four decimal places and round the standard deviation to six decimal places, if necessary hat p = Box; s_{p} = Using a 96% confidence level, determine the margin of error, E, and a confidence interval for the proportion of all students at the college who work prefer eBooks over printed textbooksReport the confidence interval using interval notationReport the solutions in…arrow_forwardGiven the following dataset, calculate the lower cutoff for outliers. A: 110, 210, 389, 465, 890, 1000, 1101, 1238.arrow_forwardDetermine whether the data has any outliers. If so, how many? Show your calculation or provide a detailed explanation on how you reached this conclusion. 15 12 6.2 7 5.5 2 4 5 10 11 7 6 4 7 01 5 3.2 4 10 6 2 10 1.5 5.1 6.4 8 14 3 2arrow_forward
arrow_back_ios
SEE MORE QUESTIONS
arrow_forward_ios
Recommended textbooks for you
 Glencoe Algebra 1, Student Edition, 9780079039897...AlgebraISBN:9780079039897Author:CarterPublisher:McGraw Hill
Glencoe Algebra 1, Student Edition, 9780079039897...
Algebra
ISBN:9780079039897
Author:Carter
Publisher:McGraw Hill
Hypothesis Testing using Confidence Interval Approach; Author: BUM2413 Applied Statistics UMP;https://www.youtube.com/watch?v=Hq1l3e9pLyY;License: Standard YouTube License, CC-BY
Hypothesis Testing - Difference of Two Means - Student's -Distribution & Normal Distribution; Author: The Organic Chemistry Tutor;https://www.youtube.com/watch?v=UcZwyzwWU7o;License: Standard Youtube License