
STATISTICS F/BUSINESS+ECONOMICS-TEXT
13th Edition
ISBN: 9781305881884
Author: Anderson
Publisher: CENGAGE L
expand_more
expand_more
format_list_bulleted
Videos
Textbook Question
Chapter 3.4, Problem 52E
Consumer Reports provided overall customer satisfaction scores for AT&T, Sprint, T-Mobile, and Verizon cell-phone services in major metropolitan areas throughout the United States. The rating for each service reflects the overall customer satisfaction considering a variety of factors such as cost, connectivity problems, dropped calls, static interference, and customer support. A satisfaction scale from 0 to 100 was used with 0 indicating completely dissatisfied and 100 indicating completely satisfied. The ratings for the four cell-phone services in 20 metropolitan areas are as shown (Consumer Reports, January 2009).
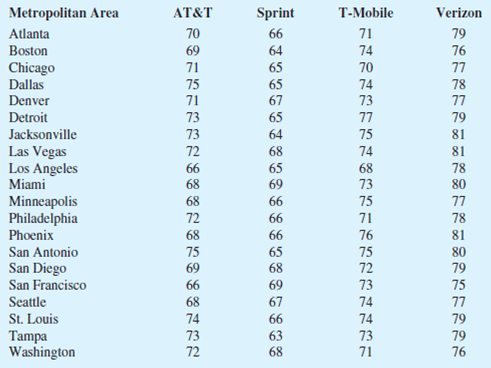
- a. Consider T-Mobile first. What is the median rating?
- b. Develop a five-number summary for the T-Mobile service.
- c. Are there outliers for T-Mobile? explain.
- d. Repeat parts (b) and (c) for the other three cell-phone services.
- e. Show the box plots for the four cell-phone services on one graph. Discuss what a comparison of the box plots tells about the four services. Which service did Consumer Reports recommend as being best in terms of overall customer satisfaction?
Expert Solution & Answer

Trending nowThis is a popular solution!

Students have asked these similar questions
Each year a market research company surveys new car owners 90 days after they purchase their cars. This data is used to rate auto brands (such as Toyota and Ford) on quality and customer satisfaction. Suppose the following were the quality rating and satisfaction scores for 30 brands sold in the United States. Brand Quality Rating Satisfaction Rating Acura 64 814 Audi 80 863 BMW 76 849 Buick 74 792 Cadillac 58 826 Chevrolet 64 791 Chrysler 58 783 Dodge 58 790 Fiat 38 768 Ford 66 789 GMC 60 791 Honda 71 783 Hyundai 70 804 Infiniti 63 821 Jeep 43 762 Kia 72 791 LandRover 55 858 Lexus 76 844 Lincoln 65 835 Mazda 74 790 Mercedes-Benz 67 842 MINI 68 795 Mitsubishi 51 748 Nissan 63 786 Porsche 76 882 Scion 65 779 Subaru 78 766 Toyota 72 783 Volkswagen 67 796 Volvo 69 812 (a) Construct a scatterplot of y = satisfaction rating versus x = quality rating. A scatterplot has 30 points.The horizontal axis is labeled "x" and has values from 35 to 85. The vertical axis is labeled "y" and has values…
Each year a market research company surveys new car owners 90 days after they purchase their cars. This data is used to rate auto brands (such as Toyota and Ford) on quality and customer satisfaction. Suppose the following were the quality rating and satisfaction scores for 30 brands sold in the United States.
Brand
Quality Rating
Satisfaction Rating
Acura
64
814
Audi
80
863
BMW
76
849
Buick
74
792
Cadillac
58
826
Chevrolet
64
791
Chrysler
58
783
Dodge
58
790
Fiat
38
763
Ford
66
789
GMC
60
791
Honda
71
783
Hyundai
70
804
Infiniti
63
826
Jeep
43
762
Kia
72
791
LandRover
55
848
Lexus
76
844
Lincoln
65
835
Mazda
74
790
Mercedes-Benz
67
842
MINI
68
795
Mitsubishi
51
748
Nissan
63
786
Porsche
76
882
Scion
65
779
Subaru
78
766
Toyota
72
783
Volkswagen
67
796
Volvo
69
812
Calculate the value of the correlation coefficient. (Round your answer to four decimal places.)
The director of student services at San Bernardino Valley College is interested in whether women are more likely to attend orientation than men before they begin their coursework. A random sample of freshmen at San Bernardino Valley College were asked to specify their gender and whether they attended the orientation. The results of the survey are shown below:
Data for Gender vs. Orientation Attendance
Women
Men
Yes
375
336
No
316
329
Let p1p1 be the proportion of women who attended the orientation and p2p2 be the proportion of men who attended the orientation. What can be concluded at the αα = 0.10 level of significance?
What is the test statistic and p value
Chapter 3 Solutions
STATISTICS F/BUSINESS+ECONOMICS-TEXT
Ch. 3.1 - Consider a sample with data values of 10, 20, 12,...Ch. 3.1 - Consider a sample with data values of 10, 20, 21,...Ch. 3.1 - Consider the following data and corresponding...Ch. 3.1 - Consider the following data. Period Rate of Return...Ch. 3.1 - Consider a sample with data values of 27, 25, 20,...Ch. 3.1 - Consider a sample with data values of 53, 55, 70,...Ch. 3.1 - The average number of minutes Americans commute to...Ch. 3.1 - The Wall Street Journal reported that the median...Ch. 3.1 - Which companies spend the most money on...Ch. 3.1 - Over a nine-month period, OutdoorGearLab tested...
Ch. 3.1 - According to the National Education Association...Ch. 3.1 - The Big Bang Theory, a situation comedy featuring...Ch. 3.1 - In automobile mileage and gasoline-consumption...Ch. 3.1 - The data contained in the file named StateUnemp...Ch. 3.1 - Martinez Auto Supplies has retail stores located...Ch. 3.1 - The grade point average for college students is...Ch. 3.1 - The following table shows the total return and the...Ch. 3.1 - Based on a survey of masters programs in business...Ch. 3.1 - Annual revenue for Corning Supplies grew by 5.5%...Ch. 3.1 - Suppose that at the beginning of 2004 you invested...Ch. 3.1 - If an asset declines in value from 5000 to 3500...Ch. 3.1 - The current value of a company is 25 million. If...Ch. 3.2 - Consider a sample with data values of 10, 20, 12,...Ch. 3.2 - Consider a sample with data values of 10, 20, 12,...Ch. 3.2 - Consider a sample with data values of 27, 25, 20,...Ch. 3.2 - Data collected by the Oil Price information...Ch. 3.2 - The results of a search to find the least...Ch. 3.2 - The Australian Open is the first of the four grand...Ch. 3.2 - The Los Angeles times regularly reports the air...Ch. 3.2 - The following data were used to construct the...Ch. 3.2 - The results of Accounting Principals latest...Ch. 3.2 - Advertising age annually compiles a list of the...Ch. 3.2 - Scores turned in by an amateur golfer at the...Ch. 3.2 - The following times were recorded by the...Ch. 3.3 - Consider a sample with data values of 10, 20, 12,...Ch. 3.3 - Consider a sample with a mean of 500 and a...Ch. 3.3 - Consider a sample with a mean of 30 and a standard...Ch. 3.3 - Suppose the data have a bell-shaped distribution...Ch. 3.3 - The results of a national survey showed that on...Ch. 3.3 - The energy information Administration reported...Ch. 3.3 - The Graduate Management Admission Test (GMAT) is a...Ch. 3.3 - Many families in California are using backyard...Ch. 3.3 - According to a Los Angeles Times study of more...Ch. 3.3 - A sample of 10 NCAA college basketball game scores...Ch. 3.3 - The Wall Street Journal reported that Walmart...Ch. 3.4 - Consider a sample with data values of 27, 25, 20,...Ch. 3.4 - Prob. 47ECh. 3.4 - Prob. 48ECh. 3.4 - A data set has a first quartile of 42 and a third...Ch. 3.4 - Naples, Florida, hosts a half-marathon (13.1-mile...Ch. 3.4 - Annual sales, in millions of dollars, for 21...Ch. 3.4 - Consumer Reports provided overall customer...Ch. 3.4 - Fortune magazines list of the worlds most admired...Ch. 3.4 - The Bureau of Transportation Statistics keeps...Ch. 3.5 - Five observations taken for two variables follow....Ch. 3.5 - Five observations taken for two variables follow....Ch. 3.5 - Ten major college football bowl games were played...Ch. 3.5 - A department of transportations study on driving...Ch. 3.5 - Over the past 40 years, the percentage of homes in...Ch. 3.5 - The Russell 1000 is a stock market index...Ch. 3.5 - A random sample of 30 colleges from Kiplingers...Ch. 3 - The average number of times Americans dine out in...Ch. 3 - USA Today reports that NCAA colleges and...Ch. 3 - The average waiting time for a patient at an El...Ch. 3 - U.S. companies lose 63.2 billion per year from...Ch. 3 - A study of smartphone users shows that 68% of...Ch. 3 - Public transportation and the automobile are two...Ch. 3 - In 2007 the New York Times reported that the...Ch. 3 - The data contained in the DATAfile named...Ch. 3 - Travel + Leisure magazine provides an annual list...Ch. 3 - The 32 teams in the National Football League (NFL)...Ch. 3 - Does a major league baseball teams record during...Ch. 3 - The days to maturity for a sample of five money...Ch. 3 - Automobiles traveling on a road with a posted...Ch. 3 - The Panama Railroad Company was established in...Ch. 3 - Pelican Stores Pelican Stores, a division of...Ch. 3 - Motion Picture Industry The motion picture...Ch. 3 - Business Schools of Asia-Pacific The pursuit of a...Ch. 3 - African Elephant Populations Although millions of...
Knowledge Booster


Learn more about
Need a deep-dive on the concept behind this application? Look no further. Learn more about this topic, statistics and related others by exploring similar questions and additional content below.Similar questions
- Rebecca Chory, Ph.D., now an associate professor of communication at West Virginia University, began studying the effect of such portrayals on patients' attitudes toward physicians. Using a survey of 300 undergraduate students, she compared perceptions of physicians in 1992—the end of the era when physicians were shown as all-knowing, wise father figures—with those in 1999, when shows such as ER and Chicago Hope (1994–2000) were continuing the transformation to showing the private side and lives of physicians, including vivid demonstrations of their weaknesses and insecurities. Dr. Chory found that, regardless of the respondents' personal experience with physicians, those who watched certain kinds of television had declining perceptions of physicians' composure and regard for others. Her results indicated that the more prime time physician shows that people watched in which physicians were the main characters, the more uncaring, cold, and unfriendly the respondents thought physicians…arrow_forwardRebecca Chory, Ph.D., now an associate professor of communication at West Virginia University, began studying the effect of such portrayals on patients' attitudes toward physicians. Using a survey of 300 undergraduate students, she compared perceptions of physicians in 1992—the end of the era when physicians were shown as all-knowing, wise father figures—with those in 1999, when shows such as ER and Chicago Hope (1994–2000) were continuing the transformation to showing the private side and lives of physicians, including vivid demonstrations of their weaknesses and insecurities. Dr. Chory found that, regardless of the respondents' personal experience with physicians, those who watched certain kinds of television had declining perceptions of physicians' composure and regard for others. Her results indicated that the more prime time physician shows that people watched in which physicians were the main characters, the more uncaring, cold, and unfriendly the respondents thought physicians…arrow_forward
Recommended textbooks for you
 Glencoe Algebra 1, Student Edition, 9780079039897...AlgebraISBN:9780079039897Author:CarterPublisher:McGraw Hill
Glencoe Algebra 1, Student Edition, 9780079039897...
Algebra
ISBN:9780079039897
Author:Carter
Publisher:McGraw Hill
What Are Research Ethics?; Author: HighSchoolScience101;https://www.youtube.com/watch?v=nX4c3V23DZI;License: Standard YouTube License, CC-BY
What is Ethics in Research - ethics in research (research ethics); Author: Chee-Onn Leong;https://www.youtube.com/watch?v=W8Vk0sXtMGU;License: Standard YouTube License, CC-BY