
Concept explainers
Videos
(a)
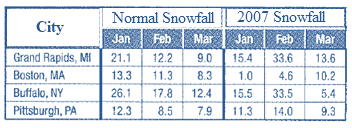
To express: Normal snowfall data and 2007 data in two
(a)
Answer to Problem 28PPS
For Normal Snowfall:
For 2007 Snowfall:
Explanation of Solution
Given information:
Table shows snowfall (in inches):

Matrix A will represent the Normal Snowfall.
We need
Such that
The rows will represent the cities.
And
The columns will represent each month.
Matrix B will represent the 2007 Snowfall.
We need
Such that
The rows will represent the cities.
And
The columns will represent each month.
(b)
To subtract: Matrix of Normal data from the matrix of 2007 data.
Representation of difference in context of the situation.
(b)
Answer to Problem 28PPS
Matrix:
The numbers in the matrix obtained represent the comparison of Snowfall in 2007 with Normal Snowfall.
Explanation of Solution
Given information:
Table shows snowfall (in inches):
We are required to subtract the 2007 Snowfall matrix from the Normal Snowfall matrix.
Subtract the corresponding elements of each matrix form.
Simplify each element to get the solution.
Thus,
The matrix obtained:
The numbers in the matrix obtained represent the comparison of Snowfall in 2007 with Normal Snowfall.
(c)
To explain: Meaning of positive and negative numbers in the difference matrix and trends observed in the data.
(c)
Answer to Problem 28PPS
For positive numbers:
There was less Snowfall than Normal Snowfall in 2007.
For negative numbers:
There was more Snowfall than Normal Snowfall in 2007.
Explanation of Solution
Given information:
Table shows snowfall (in inches):

Matrix obtained in Part (b),
From this difference matrix,
We came to know that
Some numbers are positive and some numbers are negative.
If the number is positive,
That means
There is less Snowfall in 2007 than Normal Snowfall.
If the number is negative,
That means
There is more Snowfall in 2007 than Normal Snowfall.
For Example:
Grand Rapids, MI had 5.7 fewer inches of snow than Normal in January, 2007.
For all positive numbers:
Some trends in the data represent that the overall Snowfall was very less for every city in January, 2007.
For mostly negative numbers:
There trended to be more snow in most of the cities during February and March, 2007.
Chapter 3 Solutions
Glencoe Algebra 2 Student Edition C2014
Additional Math Textbook Solutions
College Algebra (7th Edition)
College Algebra
Linear Algebra and Its Applications (5th Edition)
Introductory Statistics (10th Edition)


 Algebra and Trigonometry (6th Edition)AlgebraISBN:9780134463216Author:Robert F. BlitzerPublisher:PEARSON
 Contemporary Abstract AlgebraAlgebraISBN:9781305657960Author:Joseph GallianPublisher:Cengage Learning
 Linear Algebra: A Modern IntroductionAlgebraISBN:9781285463247Author:David PoolePublisher:Cengage Learning
 Algebra And Trigonometry (11th Edition)AlgebraISBN:9780135163078Author:Michael SullivanPublisher:PEARSON
 Introduction to Linear Algebra, Fifth EditionAlgebraISBN:9780980232776Author:Gilbert StrangPublisher:Wellesley-Cambridge Press
 College Algebra (Collegiate Math)AlgebraISBN:9780077836344Author:Julie Miller, Donna GerkenPublisher:McGraw-Hill Education