
Essentials of Statistics for Business and Economics (with XLSTAT Printed Access Card)
8th Edition
ISBN: 9781337114172
Author: David R. Anderson, Dennis J. Sweeney, Thomas A. Williams, Jeffrey D. Camm, James J. Cochran
Publisher: Cengage Learning
expand_more
expand_more
format_list_bulleted
Concept explainers
Videos
Textbook Question
Chapter 3.5, Problem 55E
Five observations taken for two variables follow.
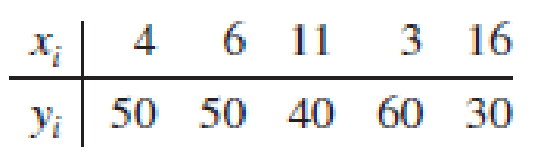
- a. Develop a scatter diagram with x on the horizontal axis.
- b. What does the scatter diagram developed in part (a) indicate about the relationship between the two variables?
- c. Compute and interpret the sample
covariance . - d. Compute and interpret the sample
correlation coefficient .
Expert Solution & Answer
Want to see the full answer?
Check out a sample textbook solution
Chapter 3 Solutions
Essentials of Statistics for Business and Economics (with XLSTAT Printed Access Card)
Ch. 3.1 - Consider a sample with data values of 10, 20, 12,...Ch. 3.1 - Consider a sample with data values of 10, 20, 21,...Ch. 3.1 - Consider the following data and corresponding...Ch. 3.1 - Consider the following data.
What is the mean...Ch. 3.1 - Consider a sample with data values of 27, 25, 20,...Ch. 3.1 - Consider a sample with data values of 53, 55, 70,...Ch. 3.1 - The average number of minutes Americans commute to...Ch. 3.1 - Prob. 8ECh. 3.1 - Advertising Spending. Which companies spend the...Ch. 3.1 - Over a nine-month period, OutdoorGearLab tested...
Ch. 3.1 - According to the National Education Association...Ch. 3.1 - The Big Bang Theory, a situation comedy featuring...Ch. 3.1 - Automobile Fuel Efficiencies. In automobile...Ch. 3.1 - The data contained in the file named StateUnemp...Ch. 3.1 - Motor Oil Prices. Martinez Auto Supplies has...Ch. 3.1 - Calculating Grade Point Averages. The grade point...Ch. 3.1 - The following table shows the total return and the...Ch. 3.1 - Business School Ranking. Based on a survey of...Ch. 3.1 - Annual revenue for Corning Supplies grew by 5.5%...Ch. 3.1 - Prob. 20ECh. 3.1 - If an asset declines in value from $5000 to $3500...Ch. 3.1 - The current value of a company is 25 million. If...Ch. 3.2 - Consider a sample with data values of 10, 20, 12,...Ch. 3.2 - Consider a sample with data values of 10, 20, 12,...Ch. 3.2 - Consider a sample with data values of 27, 25, 20,...Ch. 3.2 - Price of Unleaded Gasoline. Data collected by the...Ch. 3.2 - The results of a search to find the least...Ch. 3.2 - The Australian Open is the first of the four Grand...Ch. 3.2 - Air Quality Index. The Los Angeles Times regularly...Ch. 3.2 - Prob. 30ECh. 3.2 - The results of Accounting Principals’ latest...Ch. 3.2 - Advertising Spend by Companies. Advertising Age...Ch. 3.2 - Scores turned in by an amateur golfer at the...Ch. 3.2 - Consistency of Running Times. The following times...Ch. 3.3 - Consider a sample with data values of 10, 20, 12,...Ch. 3.3 - Prob. 36ECh. 3.3 - Consider a sample with a mean of 30 and a standard...Ch. 3.3 - Suppose the data have a bell-shaped distribution...Ch. 3.3 - The results of a national survey showed that on...Ch. 3.3 - The Energy Information Administration reported...Ch. 3.3 - GMAT Exam Scores. The Graduate Management...Ch. 3.3 - Many families in California are using backyard...Ch. 3.3 - Prob. 43ECh. 3.3 - NCAA Basketball Game Scores. A sample of 10 NCAA...Ch. 3.3 - Prob. 45ECh. 3.4 - Consider a sample with data values of 27, 25, 20,...Ch. 3.4 - Show the boxplot for the data in exercise 46. 46....Ch. 3.4 - Prob. 48ECh. 3.4 - Prob. 49ECh. 3.4 - Naples Half-Marathon Times. Naples, Florida, hosts...Ch. 3.4 - Annual sales, in millions of dollars, for 21...Ch. 3.4 - Cell Phone Companies Customer Satisfaction....Ch. 3.4 - Most Admired Companies. Fortune magazines list of...Ch. 3.4 - U.S. Border Crossings. The Bureau of...Ch. 3.5 - Five observations taken for two variables follow....Ch. 3.5 - Five observations taken for two variables follow....Ch. 3.5 - Ten major college football bowl games were played...Ch. 3.5 - Driving Speed and Fuel Efficiency. A department of...Ch. 3.5 - Smoke Detector Use and Death Rates. Over the past...Ch. 3.5 - Stock Market Indexes Comparison. The Russell 1000...Ch. 3.5 - Best Private Colleges. A random sample of 30...Ch. 3 - Prob. 62SECh. 3 - USA Today reports that NCAA colleges and...Ch. 3 - Physician Office Waiting Times. The average...Ch. 3 - Worker Productivity and Insomnia. U.S. companies...Ch. 3 - A study of smartphone users shows that 68% of...Ch. 3 - Prob. 67SECh. 3 - Prob. 68SECh. 3 - Prob. 69SECh. 3 - Best Hotels. Travel + Leisure magazine provides an...Ch. 3 - Prob. 71SECh. 3 - MLB Team Winning Percentages. Does a major league...Ch. 3 - Money Market Funds Days to Maturity. The days to...Ch. 3 - Automobile Speeds. Automobiles traveling on a road...Ch. 3 - Annual Returns for Panama Railroad Company Stock....Ch. 3 - Pelican Stores, a division of National Clothing,...Ch. 3 - The motion picture industry is a competitive...Ch. 3 - The pursuit of a higher education degree in...Ch. 3 - Although millions of elephants once roamed across...
Knowledge Booster


Learn more about
Need a deep-dive on the concept behind this application? Look no further. Learn more about this topic, statistics and related others by exploring similar questions and additional content below.Recommended textbooks for you
 Glencoe Algebra 1, Student Edition, 9780079039897...AlgebraISBN:9780079039897Author:CarterPublisher:McGraw Hill
Glencoe Algebra 1, Student Edition, 9780079039897...
Algebra
ISBN:9780079039897
Author:Carter
Publisher:McGraw Hill
Correlation Vs Regression: Difference Between them with definition & Comparison Chart; Author: Key Differences;https://www.youtube.com/watch?v=Ou2QGSJVd0U;License: Standard YouTube License, CC-BY
Correlation and Regression: Concepts with Illustrative examples; Author: LEARN & APPLY : Lean and Six Sigma;https://www.youtube.com/watch?v=xTpHD5WLuoA;License: Standard YouTube License, CC-BY