
Essentials of Statistics for Business and Economics (with XLSTAT Printed Access Card)
8th Edition
ISBN: 9781337114172
Author: David R. Anderson, Dennis J. Sweeney, Thomas A. Williams, Jeffrey D. Camm, James J. Cochran
Publisher: Cengage Learning
expand_more
expand_more
format_list_bulleted
Videos
Textbook Question
Chapter 3.1, Problem 12E
The Big Bang Theory, a situation comedy featuring Johnny Galecki, Jim Parsons, and Kaley Cuoco-Sweeting, is one of the most watched programs on network television. The first two episodes for the 2011–2012 season premiered on September 22, 2011; the first episode attracted 14.1 million viewers and the second episode attracted 14.7 million viewers. The following table shows the number of viewers in millions for the first 21 episodes of the 2011–2012 season (The Big Bang Theory website, April 17, 2012).
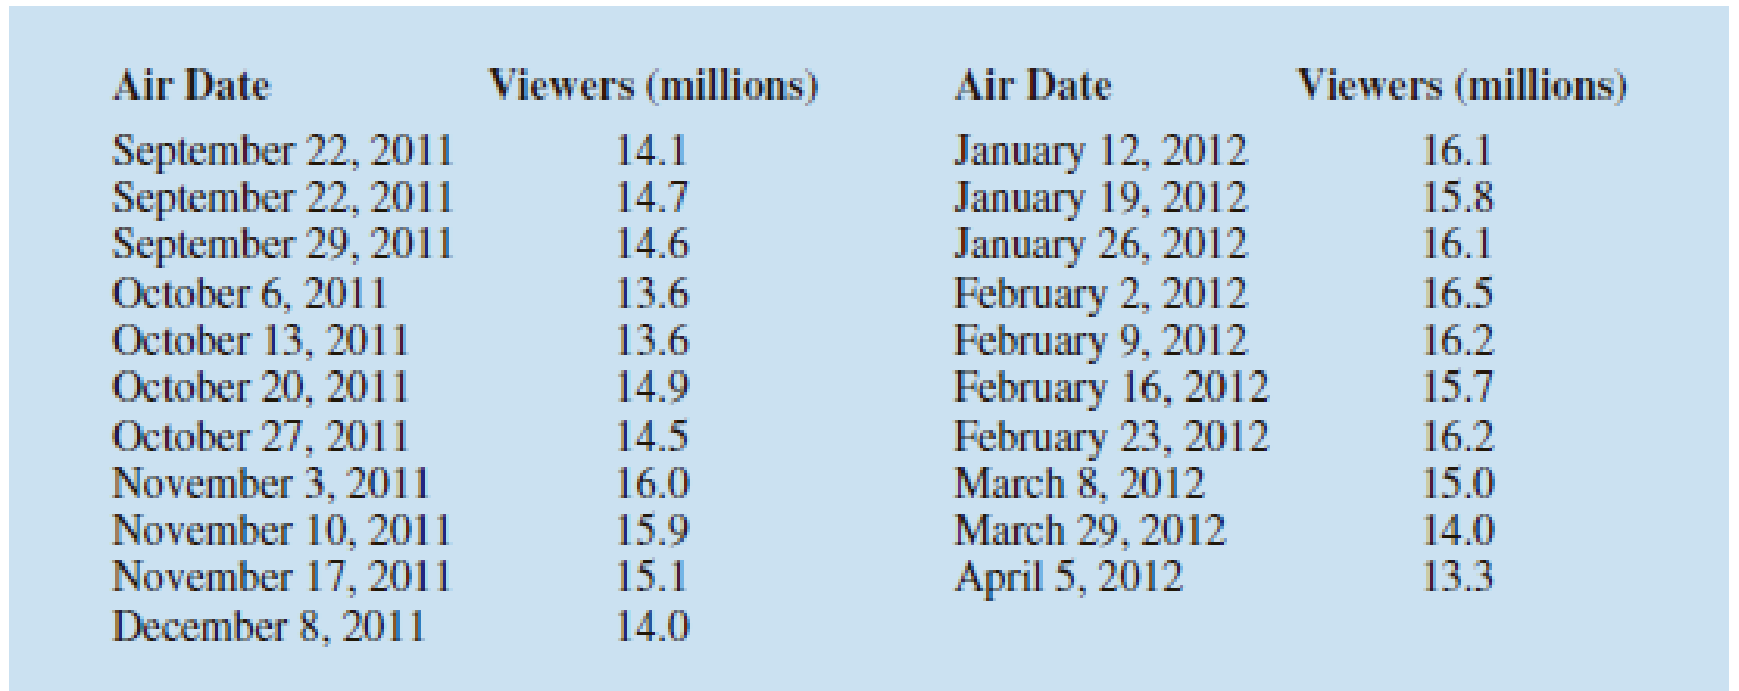
- a. Compute the minimum and maximum number of viewers.
- b. Compute the
mean , median, andmode . - c. Compute the first and third quartiles.
- d. H as viewership grown or declined over the 2011–2012 season? Discuss.
Expert Solution & Answer
Want to see the full answer?
Check out a sample textbook solution
Students have asked these similar questions
Subject: Stochastic process
Question 1 is attached to the image section below
Can you explain the Chebyshev's Theory?
A researcher conducts a research study to examine whether there is a difference between two treatments regarding depression. Which of the following is consistent conceptually with the alternative hypothesis?
a.
The second treatment is less effective than the first treatment regarding depression.
b.
There is a difference between the two treatments among the general population regarding depression.
c.
There is no difference between the two treatments among the general population regarding depression.
d.
The first treatment is less effective than the second treatment regarding depression.
Chapter 3 Solutions
Essentials of Statistics for Business and Economics (with XLSTAT Printed Access Card)
Ch. 3.1 - Consider a sample with data values of 10, 20, 12,...Ch. 3.1 - Consider a sample with data values of 10, 20, 21,...Ch. 3.1 - Consider the following data and corresponding...Ch. 3.1 - Consider the following data.
What is the mean...Ch. 3.1 - Consider a sample with data values of 27, 25, 20,...Ch. 3.1 - Consider a sample with data values of 53, 55, 70,...Ch. 3.1 - The average number of minutes Americans commute to...Ch. 3.1 - Prob. 8ECh. 3.1 - Advertising Spending. Which companies spend the...Ch. 3.1 - Over a nine-month period, OutdoorGearLab tested...
Ch. 3.1 - According to the National Education Association...Ch. 3.1 - The Big Bang Theory, a situation comedy featuring...Ch. 3.1 - Automobile Fuel Efficiencies. In automobile...Ch. 3.1 - The data contained in the file named StateUnemp...Ch. 3.1 - Motor Oil Prices. Martinez Auto Supplies has...Ch. 3.1 - Calculating Grade Point Averages. The grade point...Ch. 3.1 - The following table shows the total return and the...Ch. 3.1 - Business School Ranking. Based on a survey of...Ch. 3.1 - Annual revenue for Corning Supplies grew by 5.5%...Ch. 3.1 - Prob. 20ECh. 3.1 - If an asset declines in value from $5000 to $3500...Ch. 3.1 - The current value of a company is 25 million. If...Ch. 3.2 - Consider a sample with data values of 10, 20, 12,...Ch. 3.2 - Consider a sample with data values of 10, 20, 12,...Ch. 3.2 - Consider a sample with data values of 27, 25, 20,...Ch. 3.2 - Price of Unleaded Gasoline. Data collected by the...Ch. 3.2 - The results of a search to find the least...Ch. 3.2 - The Australian Open is the first of the four Grand...Ch. 3.2 - Air Quality Index. The Los Angeles Times regularly...Ch. 3.2 - Prob. 30ECh. 3.2 - The results of Accounting Principals’ latest...Ch. 3.2 - Advertising Spend by Companies. Advertising Age...Ch. 3.2 - Scores turned in by an amateur golfer at the...Ch. 3.2 - Consistency of Running Times. The following times...Ch. 3.3 - Consider a sample with data values of 10, 20, 12,...Ch. 3.3 - Prob. 36ECh. 3.3 - Consider a sample with a mean of 30 and a standard...Ch. 3.3 - Suppose the data have a bell-shaped distribution...Ch. 3.3 - The results of a national survey showed that on...Ch. 3.3 - The Energy Information Administration reported...Ch. 3.3 - GMAT Exam Scores. The Graduate Management...Ch. 3.3 - Many families in California are using backyard...Ch. 3.3 - Prob. 43ECh. 3.3 - NCAA Basketball Game Scores. A sample of 10 NCAA...Ch. 3.3 - Prob. 45ECh. 3.4 - Consider a sample with data values of 27, 25, 20,...Ch. 3.4 - Show the boxplot for the data in exercise 46. 46....Ch. 3.4 - Prob. 48ECh. 3.4 - Prob. 49ECh. 3.4 - Naples Half-Marathon Times. Naples, Florida, hosts...Ch. 3.4 - Annual sales, in millions of dollars, for 21...Ch. 3.4 - Cell Phone Companies Customer Satisfaction....Ch. 3.4 - Most Admired Companies. Fortune magazines list of...Ch. 3.4 - U.S. Border Crossings. The Bureau of...Ch. 3.5 - Five observations taken for two variables follow....Ch. 3.5 - Five observations taken for two variables follow....Ch. 3.5 - Ten major college football bowl games were played...Ch. 3.5 - Driving Speed and Fuel Efficiency. A department of...Ch. 3.5 - Smoke Detector Use and Death Rates. Over the past...Ch. 3.5 - Stock Market Indexes Comparison. The Russell 1000...Ch. 3.5 - Best Private Colleges. A random sample of 30...Ch. 3 - Prob. 62SECh. 3 - USA Today reports that NCAA colleges and...Ch. 3 - Physician Office Waiting Times. The average...Ch. 3 - Worker Productivity and Insomnia. U.S. companies...Ch. 3 - A study of smartphone users shows that 68% of...Ch. 3 - Prob. 67SECh. 3 - Prob. 68SECh. 3 - Prob. 69SECh. 3 - Best Hotels. Travel + Leisure magazine provides an...Ch. 3 - Prob. 71SECh. 3 - MLB Team Winning Percentages. Does a major league...Ch. 3 - Money Market Funds Days to Maturity. The days to...Ch. 3 - Automobile Speeds. Automobiles traveling on a road...Ch. 3 - Annual Returns for Panama Railroad Company Stock....Ch. 3 - Pelican Stores, a division of National Clothing,...Ch. 3 - The motion picture industry is a competitive...Ch. 3 - The pursuit of a higher education degree in...Ch. 3 - Although millions of elephants once roamed across...
Knowledge Booster


Learn more about
Need a deep-dive on the concept behind this application? Look no further. Learn more about this topic, statistics and related others by exploring similar questions and additional content below.Similar questions
- What would be my research hypothesis for this scenario?arrow_forwardSI jinx Players in any sport who are having greatseasons, turning in performances that are much betterthan anyone might have anticipated, often are picturedon the cover of Sports Illustrated. Frequently, their performances then falter somewhat, leading some ath-letes to believe in a “Sports Illustrated jinx.” Similarly, it is common for phenomenal rookies to have less stel-lar second seasons—the so-called “sophomore slump.” While fans, athletes, and analysts have proposed many theories about what leads to such declines, a statisti-cian might offer a simpler (statistical) explanation. Explain.arrow_forwardFor 25 years, Arthur Reynolds and Judy Temple tracked more than 1,400 children who participated in a publicly funded early childhood development program beginning at age 3. They found that children who participated in the program showed higher levels of educational attainment, socioeconomic status, and job skills, as well as lower rates of substance abuse, felony arrest, and incarceration, than those who did not receive school-based early education. One possible theory for the success of this program is that improving school readiness improved the children's success in school. The improved success in school in turn improved their readiness for adulthood, resulting in increased job skills and socioeconomic status as well as lower rates of substance abuse.arrow_forward
- For 25 years, Arthur Reynolds and Judy Temple tracked more than 1,400 children who participated in a publicly funded early childhood development program beginning at age 3. They found that children who participated in the program showed higher levels of educational attainment, socioeconomic status, and job skills, as well as lower rates of substance abuse, felony arrest, and incarceration, than those who did not receive school-based early education. One possible theory for the success of this program is that improving school readiness improved the children's success in school. The improved success in school in turn improved their readiness for adulthood, resulting in increased job skills and socioeconomic status as well as lower rates of substance abuse. What is the independent and dependent variable?arrow_forwardAnswer A, B1, and B2: A. The National Institute of Mental Health published an article stating that in any one-year period, approximately 9.5 percent of American adults suffer from depression or a depressive illness. Suppose that in a survey of 100 people in a certain town, seven of them suffered from depression or a depressive illness. Conduct a hypothesis test to determine if the true proportion of people in that town suffering from depression or a depressive illness is lower than the percent in the general adult American population. B. Researchers interested in lead exposure due to car exhaust sampled the blood of 52 police officers subjected to constant inhalation of automobile exhaust fumes while working traffic enforcement in a primarily urban environment. The blood samples of these officers had an average lead concentration of 124.32 µg/l and a SD of 37.74 µg/l; a previous study of individuals from a nearby suburb, with no history of exposure, found an average blood level…arrow_forwardWhich of the following is an advantage of qualitative research? Select an answer and submit. For keyboard navigation, use the up/down arrow keys to select an answer. a It is well-suited for exploring hidden reasons behind complex, interrelated, or multifaceted social processes. b It is often helpful for theory construction in areas with no or insufficient a priori theory. c It is appropriate for studying context-specific, unique, or idiosyncratic events or processes. d All of the abovearrow_forward
- Assume the chances of failure of each component is given in Figure. What is the probability that the system would not work? .arrow_forwardSuppose two forces Red and Blue, with Red having a starting force = 2, and Blue having a starting force = 1. Engage in a stochastic Lanchester battle assuming square law, in a fight-to-the-finish, with Red a = 0.01 casualties per minute, and Blue b = 0.03 casualties per minute. (a) What is the expected time of the first casualty?(b) What is the probability that there are no casualties in the first 20 minutes?(c) What is the expected number of Red survivors and the expected length of the battle?arrow_forwardb) What are the three models proposed as extensions of the GARCH model? Describe their advantages over the GARCH.arrow_forward
- Consider the following payoff matrix.arrow_forwardA store manager observes that the morale of employees in her supermarket is low. She thinks that if their working conditions are improved, pay scales rose, and the vacation benefits made more attractive, the morale will be boosted. She doubts, however, if an increase in pay scales would raise the morale of all employees. Her conjecture is that those who have supplemental incomes will just not be “turned on” by higher pay, and only those without side incomes will be happy with increased pay, with a resultant boost in morale Based on the scenario presented, answer the following questions: A) Identify the Independent, Dependent, Moderating, and Mediating Variables. Also provide justification for your choice. B) Create a schematic diagram (i.e., conceptual framework) that depicts the relationships among the variables. C) Based on the above conceptual framework develops at least four alternate hypotheses.arrow_forwardA certain university claims that for the last school year the proportion of students who were not able to earn a college diploma is at most 25%. What is the null hypothesis? a. Proportion is greater than or equal to 0.25.b. Proportion is less than or equal to 0.25.c. Proportion is equal to 0.25.d. Proportion is not equal to 0.25.arrow_forward
arrow_back_ios
SEE MORE QUESTIONS
arrow_forward_ios
Recommended textbooks for you
 MATLAB: An Introduction with ApplicationsStatisticsISBN:9781119256830Author:Amos GilatPublisher:John Wiley & Sons Inc
 Probability and Statistics for Engineering and th...StatisticsISBN:9781305251809Author:Jay L. DevorePublisher:Cengage Learning
 Statistics for The Behavioral Sciences (MindTap C...StatisticsISBN:9781305504912Author:Frederick J Gravetter, Larry B. WallnauPublisher:Cengage Learning
 Elementary Statistics: Picturing the World (7th E...StatisticsISBN:9780134683416Author:Ron Larson, Betsy FarberPublisher:PEARSON
 The Basic Practice of StatisticsStatisticsISBN:9781319042578Author:David S. Moore, William I. Notz, Michael A. FlignerPublisher:W. H. Freeman
 Introduction to the Practice of StatisticsStatisticsISBN:9781319013387Author:David S. Moore, George P. McCabe, Bruce A. CraigPublisher:W. H. Freeman
MATLAB: An Introduction with Applications
Statistics
ISBN:9781119256830
Author:Amos Gilat
Publisher:John Wiley & Sons Inc
Probability and Statistics for Engineering and th...
Statistics
ISBN:9781305251809
Author:Jay L. Devore
Publisher:Cengage Learning
Statistics for The Behavioral Sciences (MindTap C...
Statistics
ISBN:9781305504912
Author:Frederick J Gravetter, Larry B. Wallnau
Publisher:Cengage Learning
Elementary Statistics: Picturing the World (7th E...
Statistics
ISBN:9780134683416
Author:Ron Larson, Betsy Farber
Publisher:PEARSON
The Basic Practice of Statistics
Statistics
ISBN:9781319042578
Author:David S. Moore, William I. Notz, Michael A. Fligner
Publisher:W. H. Freeman
Introduction to the Practice of Statistics
Statistics
ISBN:9781319013387
Author:David S. Moore, George P. McCabe, Bruce A. Craig
Publisher:W. H. Freeman
what is Research Design, Research Design Types, and Research Design Methods; Author: Educational Hub;https://www.youtube.com/watch?v=LpmGSioXxdo;License: Standard YouTube License, CC-BY