
Gen Combo Ll Applied Statistics In Business & Economics; Connect Access Card
6th Edition
ISBN: 9781260260632
Author: David Doane, Lori Seward Senior Instructor of Operations Management
Publisher: McGraw-Hill Education
expand_more
expand_more
format_list_bulleted
Videos
Textbook Question
Chapter 3.6, Problem 18SE
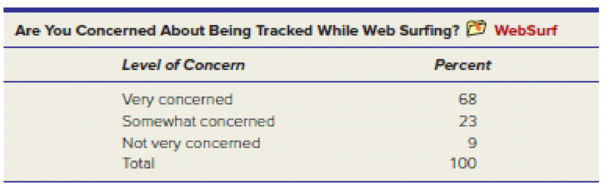
(a) Use Excel to prepare a 2-D pie chart for these web-surfing data. Modify the default colors, fonts, etc., as you judge appropriate to make the display effective. (b) Right-click the chart area, select Chart Type, and change to an exploded 2-D pie chart. (c) Right-click the chart area, select Chart Type, and change to a bar chart. Which do you prefer? Why? Hint: Include data labels with the percent values.
Expert Solution & Answer
Want to see the full answer?
Check out a sample textbook solution
Students have asked these similar questions
The inspector wants you to create a blueprint for the basketball court. Using the top
view of the court given in the image below, check (V the box if the colored elements
marked on the court pass the vertical line test.
Yellow
Blue
Green
000
what is mode?
How will I draw the bar chart using the data provided in the picture by using R code?
The X-axis will be the month labels
The Y-axis will be the immigrant data.
Thanks.
Chapter 3 Solutions
Gen Combo Ll Applied Statistics In Business & Economics; Connect Access Card
Ch. 3.1 - (a) Make a stem-and-leaf plot for these 24...Ch. 3.1 - (a) Make a stem-and-leaf plot for the number of...Ch. 3.1 - (a) Make a stacked dot plot to compare the lengths...Ch. 3.2 - (a) The table shows the number of days on the...Ch. 3.2 - (a) The table shows raw scores on a state civil...Ch. 3.2 - (a) Make a frequency distribution and histogram...Ch. 3.2 - (a) Make a frequency distribution and histogram...Ch. 3.2 - (a) Make a frequency distribution and histogram...Ch. 3.2 - For each frequency distribution, suggest nice...Ch. 3.2 - Below are sorted data showing average spending per...
Ch. 3.4 - (a) Use Excel to prepare a line chart to display...Ch. 3.4 - Prob. 12SECh. 3.4 - Prob. 13SECh. 3.4 - (a) Use Excel to prepare a line chart to display...Ch. 3.5 - Prob. 15SECh. 3.5 - The table shows the number of TVs sold by a major...Ch. 3.6 - (a) Use Excel to prepare a 2-D pie chart for these...Ch. 3.6 - Prob. 19SECh. 3.6 - Prob. 20SECh. 3.7 - (a) Use Excel to make a scatter plot of the data...Ch. 3.7 - Prob. 22SECh. 3.7 - Prob. 23SECh. 3.7 - (a) Use Excel to make a scatter plot of the data,...Ch. 3 - Name two attractive features and two limitations...Ch. 3 - (a) What is a frequency distribution? (b) What are...Ch. 3 - (a) What is a histogram? (b) What does it show?Ch. 3 - (a) What is a bimodal histogram? (b) Explain the...Ch. 3 - (a) What is a scatter plot? (b) What do scatter...Ch. 3 - For what kind of data would we use a bar chart?...Ch. 3 - For what kind of data would we use a line chart?...Ch. 3 - (a) List the three most common types of charts in...Ch. 3 - (a) For what kind of data would we use a pie...Ch. 3 - Which types of charts can be used for time series...Ch. 3 - (a) When might we need a log scale? (b) What do...Ch. 3 - When might we use a stacked column chart? An area...Ch. 3 - List five deceptive graphical techniques.Ch. 3 - What is a pivot table? Why is it useful?Ch. 3 - The durations (minutes) of 26 electric power...Ch. 3 - The U.S. Postal Service will ship a Priority Mail,...Ch. 3 - A study of 40 U.S. cardiac care centers showed the...Ch. 3 - Prob. 28CECh. 3 - An executives telephone log showed the following...Ch. 3 - Below are batting averages of the New York Yankees...Ch. 3 - Prob. 31CECh. 3 - Prob. 32CECh. 3 - Download the full data set from the McGraw-Hill...Ch. 3 - (a) What kind of display is this? (b) Identify its...Ch. 3 - (a) What kind of display is this? (b) Identify its...Ch. 3 - (a) What kind of display is this? (b) Identify its...Ch. 3 - (a) What kind of display is this? (b) Identify its...Ch. 3 - Prob. 38CECh. 3 - (a) What kind of display is this? (b) Identify its...Ch. 3 - (a) What kind of display is this? (b) Identify its...Ch. 3 - Prob. 41CECh. 3 - Prob. 42CECh. 3 - (a) Use Excel to prepare an appropriate type of...Ch. 3 - Prob. 44CECh. 3 - Prob. 45CECh. 3 - (a) Use Excel to prepare an appropriate type of...Ch. 3 - Prob. 47CECh. 3 - (a) Use Excel to prepare an appropriate type of...
Knowledge Booster


Learn more about
Need a deep-dive on the concept behind this application? Look no further. Learn more about this topic, statistics and related others by exploring similar questions and additional content below.Similar questions
- Hi could you fill this out for me?arrow_forwardCreate a set of data that is represented by the box plot below.arrow_forwardIn class, we compared healing times for females who received an experimental cold sore medicine. The data for the male control and treatment groups are provided below; they represent the number of days that passed before the sores were completely gone. In your notebook, make a dotplot for each group. Control: 20,13,22,21,16,5,21,11,16,14,15,15,13,16,10,17,16,11,21 Treatment: 11,16,8,16,15,12,11,12,12,9,11,19,16,13,5,15,12,8,11 Part A: Calculate the mean healing time for the control group, rounding your result to the nearest hundredth. In your notebook, mark an "X" on the horizontal axis of your dotplot to show the mean.Mean = daysPart B: Calculate the mean healing time for the treatment group, rounding your result to the nearest hundredth. In your notebook, mark an "X" on the horizontal axis of your dotplot to show the mean.Mean = daysarrow_forward
- Describe the two shapes of the two data sets from histograms.arrow_forwardIdentify the mode of the set of data: 87,90,86,95,2,87,88,94,86,97 ?a. 90b. 87c. 86d. 85arrow_forwardDetermine whether the data are qualitative or quantitative. the colors of automobiles on a used car lot O qualitative quantitativearrow_forward
- Need help on letters A-G (all questions). Thank you.arrow_forwardThe data were collected from a statistics class. The column head gives the variable, and each of the rows represents a student in the class. Find the frequency, proportion, and percentage of women. Click the icon to view the data table. Stats class data The frequency of women in the class is (Type an integer or a decimal.) Shoe Height Weight Size (inches)(pounds) of Siblings Number College Units Eye Color The proportion of women in the class is Male Age Handedness This Term (Type an integer or a fraction.) 31 Hazel 7.5 65 130 4 12 Right The percentage of women in the class is %. 32 Blue 10.5 69 140 1 9. Left (Round to one decimal place as needed.) 1 30 Brown 7.5 65 175 2 9. Left Right Right Left 1 30 Blue 10 61 150 1 7 1 30 Hazel 11.5 67 125 6. 7 1 30 Blue 9 64 135 9 1 29 Blue 7.5 61 150 2 15 Left Right Right Left 1 21 Brown 12.5 65 185 7 12 1 20 Blue 6. 69 120 1 11 ㅇ 22 Brown 7.5 61 190 8 1 20 Hazel 10.5 65 145 13 Right Print Donearrow_forwardHow do you find lcd.arrow_forward
- Suppose you need to summarize ordinal data in a bar graph. How would you arrange the categories of data on the horizontal axis? Is it possible to make the order of the data apparent in a pie chart?arrow_forwardWhat is the importance of using pie/bar charts or graph when representing data?arrow_forwardI need to know if it's sss,asa,aas,sas or sas and asa.arrow_forward
arrow_back_ios
SEE MORE QUESTIONS
arrow_forward_ios
Recommended textbooks for you
 Holt Mcdougal Larson Pre-algebra: Student Edition...AlgebraISBN:9780547587776Author:HOLT MCDOUGALPublisher:HOLT MCDOUGAL
 Elementary AlgebraAlgebraISBN:9780998625713Author:Lynn Marecek, MaryAnne Anthony-SmithPublisher:OpenStax - Rice University
Holt Mcdougal Larson Pre-algebra: Student Edition...
Algebra
ISBN:9780547587776
Author:HOLT MCDOUGAL
Publisher:HOLT MCDOUGAL
Elementary Algebra
Algebra
ISBN:9780998625713
Author:Lynn Marecek, MaryAnne Anthony-Smith
Publisher:OpenStax - Rice University
F- Test or F- statistic (F- Test of Equality of Variance); Author: Prof. Arvind Kumar Sing;https://www.youtube.com/watch?v=PdUt7InTyc8;License: Standard Youtube License
Statistics 101: F-ratio Test for Two Equal Variances; Author: Brandon Foltz;https://www.youtube.com/watch?v=UWQO4gX7-lE;License: Standard YouTube License, CC-BY
Hypothesis Testing and Confidence Intervals (FRM Part 1 – Book 2 – Chapter 5); Author: Analystprep;https://www.youtube.com/watch?v=vth3yZIUlGQ;License: Standard YouTube License, CC-BY
Understanding the Levene's Test for Equality of Variances in SPSS; Author: Dr. Todd Grande;https://www.youtube.com/watch?v=udJr8V2P8Xo;License: Standard Youtube License