
Mastering Biology with Pearson eText -- ValuePack Access Card -- for Campbell Biology: Concepts & Connections
8th Edition
ISBN: 9780321928054
Author: Jane B. Reece, Martha R. Taylor, Eric J. Simon, Jean L. Dickey, Kelly A. Hogan
Publisher: PEARSON
expand_more
expand_more
format_list_bulleted
Concept explainers
Videos
Textbook Question
Chapter 36, Problem 2CC
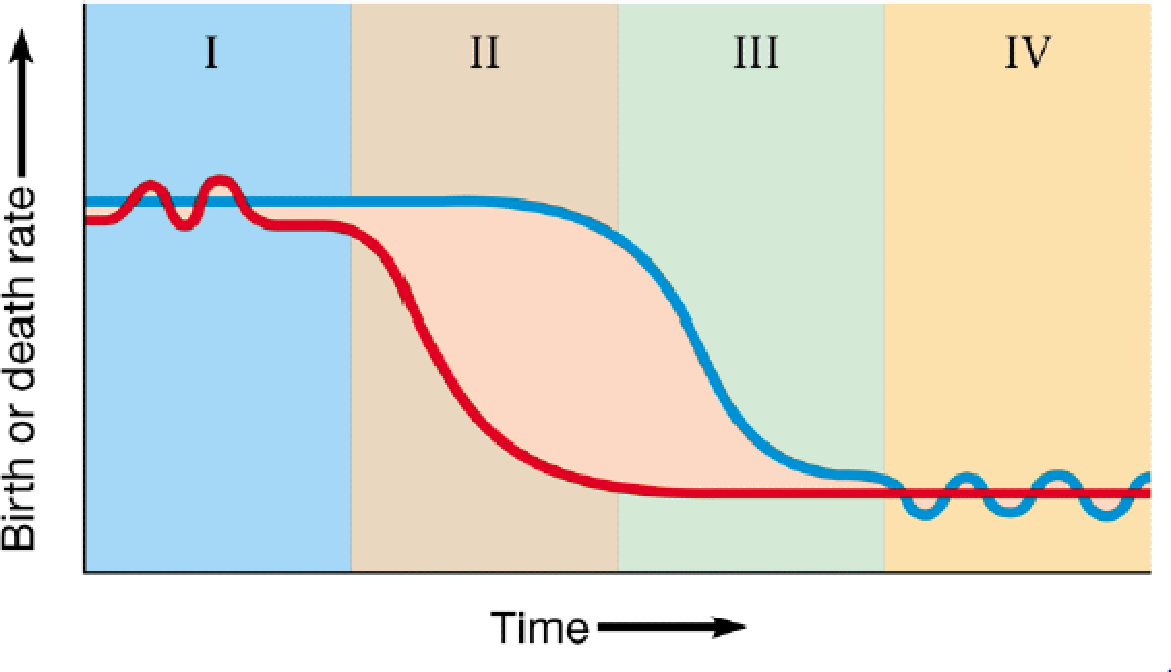
The graph below shows the demographic transition for a hypothetical country. Many developed countries that have achieved a stable
a. What does the blue line represent? The red line?
b. This diagram has been divided into four sections. Describe what is happening in each section.
c. In which section(s) is the population size stable?
d. In which section is the
Expert Solution & Answer

Trending nowThis is a popular solution!

Students have asked these similar questions
Use this graph of the idealized exponential and logistic growth curves to complete the following. a. Label the axes and curves on the graph.b. What does the dotted line represent? c. For each curve, indicate and explain where population growth is the most rapid. d. Which of these curves better represents global human population growth?
When discussing population size, we are referring to
a.
the total number of individuals in a population.
b.
the size of the geographic region in which a population is found.
c.
the number of individuals in a population divided by the area of the region covered by the population.
d.
the number of individuals in a population multiplied by the area of the region covered by the population.
e.
the specific type of environment in which a population can exist.
A population that grew in close relation to the amount of resources available in the environment, would experience
A. exponential growth, such as shown on the J-shaped curve
B. logistic growth, such as shown on the S-shaped curve
C. unpredictable growth, such as shown on the ?-shaped curve
D.logistic growth, such as shown on the J-shaped curve
E. exponential growth, such as shown on the S-shaped curve
Chapter 36 Solutions
Mastering Biology with Pearson eText -- ValuePack Access Card -- for Campbell Biology: Concepts & Connections
Ch. 36 - Use this graph of the idealized exponential and...Ch. 36 - The graph below shows the demographic transition...Ch. 36 - Prob. 3TYKCh. 36 - To figure out the human population density of your...Ch. 36 - The term (K N)/K a. is the carrying capacity for...Ch. 36 - With regard to its rate of growth, a population...Ch. 36 - Prob. 7TYKCh. 36 - Skyrocketing growth of the human population...Ch. 36 - Prob. 9TYKCh. 36 - What are some factors that might have a...
Knowledge Booster


Learn more about
Need a deep-dive on the concept behind this application? Look no further. Learn more about this topic, biology and related others by exploring similar questions and additional content below.Similar questions
- How did the population growth curve with low migration compare with the normal population growth curve? (compare one shape of the curves) how did population growth with high migration compare with goal population growth curve? (compare the shape of the curves)arrow_forwardThe graph shows the world human population size and growth rate over time. How are the two sets of data related to each other? What does studying one data set tell you about the other?arrow_forwardThe graph shows the worldwide human population from 1950 to 2050. Data for the future years are predictions. According to the ideas of Thomas Malthus, what are the predicted changes to the human population after 2050? A. The population would continue to increase at the same rate, due to constant food supplies. B. The population would increase more rapidly, due to advances in technology. C. Eventually the population would stop increasing or would decrease, due to lack of food and living space. D. Eventually the population would decrease to zero, because of war, famine, or disease.arrow_forward
- In a graph of population size versus time, a J-shaped curve is characteristic of (a) exponential population growth (b) logistic population growth (c) zero population growth (d) replacement-level fertility (e) population growth momentumarrow_forwardExplain the difference between logistic and exponential population growth. What do these growth curves look like. Which represents human population growth over the last few thousand years?arrow_forwardSome demographers claim that the total world population has already begun to slow, while others dispute this claim. How would you recognize a true demographic transition as opposed in mere random fluctuations in birth and death rates?arrow_forward
- A population that did not grow in close relation to the amount of resources available in the environment, and dramatically overshot the carrying capacity, would experience: A. logistic growth, such as shown on the S-shaped curve B. exponential growth, such as shown on the J-shaped curve C. unpredictable growth, such as shown on the ?-shaped curve D. exponential growth, such as shown on the S-shaped curve E.logistic growth, such as shown on the J-shaped curvearrow_forwardWhy are population sizes not constant in biology?arrow_forwardFor the next two items, refer to the table below of the population growth rates for Jamaica and Trinidad and Tobago in 2009.: The estimated population of Trinidad and Tobago for the year 2010 is? a. 1 363 900 b 390 000 c. 3 900 d. 1 303 900arrow_forward
- Which of the following stages of human population growth was characterized by extremely slow growth rates (about 0.0001% per year), and ranged from only 10,000 to over 5 million individuals? A. stage I (hunter/gatherer societies, without agriculture or machine industries) B. stage I (agricultural societies, without machine industries) C. stage III (industrial societies, but without widespread computer technology) D. stage IV (modern societies, with computer technology) E. all of the abovearrow_forwardWhat measurement could you use to best determine if a population is better adapted to its environment for their particular life pattern? a Increased population growth rate b Zero population growth c Decreased death rates d Increased birth ratesarrow_forwardWrite a conclusion that includes an analysis of various limiting factors and how they impacted population growth. State the purpose of the experiment using the question. Explain the background of the experiment and briefly describe the procedure. When explaining the background of the experiment, you are giving a overview of limiting factors. You should include information found in the background of the lab. Include a summary of the steps used to gather data. Describe how each of the limiting factors you studied in the simulation affected population growth and carrying capacity( migration, predation, food, disease, and pollution) include a reason why you think the limiting factor affected the population growth in this way.arrow_forward
arrow_back_ios
SEE MORE QUESTIONS
arrow_forward_ios
Recommended textbooks for you
 Biology (MindTap Course List)BiologyISBN:9781337392938Author:Eldra Solomon, Charles Martin, Diana W. Martin, Linda R. BergPublisher:Cengage Learning
Biology (MindTap Course List)
Biology
ISBN:9781337392938
Author:Eldra Solomon, Charles Martin, Diana W. Martin, Linda R. Berg
Publisher:Cengage Learning
POPULATION REGULATION AND LIMITING FACTORS | DENSITY INDEPENDENT AND DENSITY DEPENDENT FACTORS; Author: BioVidyalaya;https://www.youtube.com/watch?v=mB-AB-5Wnhs;License: Standard YouTube License, CC-BY
Population growth; Author: SiouxScience;https://www.youtube.com/watch?v=XnaC9iOumVA;License: Standard YouTube License, CC-BY