
Concept explainers
Videos
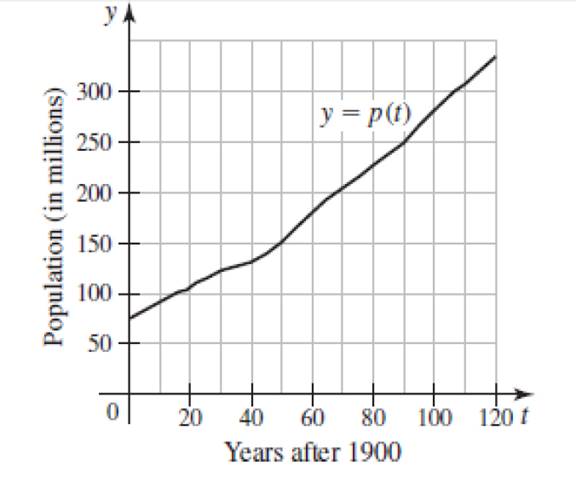
U.S. population growth The population p(t) (in millions) of the United States t years after the year 1900 is shown in the figure. Approximately when (in what year) was the U.S. population growing most slowly between 1925 and 2020? Estimate the growth rate in that year.

Trending nowThis is a popular solution!

Chapter 3 Solutions
Calculus, Early Transcendentals, Single Variable Loose-Leaf Edition Plus MyLab Math with Pearson eText - 18-Week Access Card Package
Additional Math Textbook Solutions
University Calculus: Early Transcendentals (4th Edition)
Calculus & Its Applications (14th Edition)
Precalculus: Concepts Through Functions, A Unit Circle Approach to Trigonometry (4th Edition)
Calculus and Its Applications (11th Edition)
Precalculus (10th Edition)
Precalculus Enhanced with Graphing Utilities (7th Edition)


- The fox population in a certain region has an annualgrowth rate of 9 per year. In the year 2012, therewere 23,900 fox counted in the area. What is the foxpopulation predicted to be in the year 2020 ?arrow_forwardPopulation Growth and Decline The table gives the population in a small coastal community for the period 1997-2006. Figures shown arc for January 1 in each year. (a) What was the average rate of change of population between 1998 and 2001? (b) What was the average rate of change of population between 2002 and 2004? (C) For what period of lime was the population increasing? (d) For what period of time was the population decreasing?arrow_forwardDVD Player sales The table shows the number of DVD play-ers sold in a small electronics store in the years 2003-2013. What was the average rate of change of sales between 2003 and 2013? Whatwas the average rate of change of sales between 2003 and 2004? What was the average rate of change of sales between 2004 and 2005? Between which two successive years did DVD player sales increase most quickly?arrow_forward
- Depreciation Once a new car is driven away from the dealer, it begins to lose value. Each year, a car loses 10% of its value. This means that each year the value of a car is 90% of the previous year’s value. If a new car was purchased for $20,000, the value at the end of the first year would be $20000(0.90) and the value of the car after the end of the second year would be $20000(0.90)2. Complete the table shown below. What will be the value of the car at the end of the eighth year? Simplify the expression, to show the value in dollars.arrow_forwardThe US. import of wine (in hectoliters) for several years is given in Table 5. Determine whether the trend appearslinear. Ifso, and assuming the trend continues, in what year will imports exceed 12,000 hectoliters?arrow_forwardTable 6 shows the year and the number ofpeople unemployed in a particular city for several years. Determine whether the trend appears linear. If so, and assuming the trend continues, in what year will the number of unemployed reach 5 people?arrow_forward
- Farms in the United States The graph gives the number of farms in the United States from 1850 to 2000. aEstimate the average rate of change in the number of farms between i 1860 and 1890 and ii 1950 and 1970. bIn which decade did the number of farms experience the greatest average rate of decline?arrow_forwardU.S. Population The U.S. Constitution requires a census every 10 years. The census data for 17902010 are given in the table. a Make a scatter plot of the data. b Use a calculator to find an exponential model for the data. c Use your model to predict the population at the 2020 census. d Use your model to estimate the population in 1965. Year Population in millions Year Population in millions Year Population in millions 1790 1800 1810 1820 1830 1840 1850 1860 3.9 5.3 7.2 9.6 12.9 17.1 23.2 31.4 1870 1880 1890 1900 1910 1920 1930 1940 38.6 50.2 63.0 76.2 92.2 106.0 123.2 132.2 1950 1960 1970 1980 1990 2000 2010 151.3 179.3 203.3 226.5 248.7 281.4 308.7arrow_forwardSales of a video game released in the year 2000 took off at first, but then steadily slowed as time moved on. Table 4 shows the number of games sold, in thousands, from the years 20002010. a. Let x represent time in years starting with x=1 for the year 2000. Let y represent the number of games sold in thousands. Use logarithmic regression to fit a model to these data. b. If games continue to sell at this rate, how many games will sell in 2015? Round to the nearest thousand.arrow_forward
- Effective Yield The effective yield of an investment plan is the percent increase in the balance after 1 year. Find the effective yield for each investment plan. Which investment plan has the greatest effective yield ? Which investment plan will have the highest balance after 5 years ? (a) 7 annual interest rate, compounded annually (b) 7 annual interest rate, compounded continuously (c) 7 annual interest rate, compounded quarterly (d) 7.25 annual interest rate, compounded quarterlyarrow_forwardRunning Speed A man is running around a circular track that is 200 m in circumference. An observer uses a stopwatch to record the runners time at the end of each lap, obtaining the data in the following table. aWhat was the mans average speed rate between 68 s and 152 s? bWhat was the mans average speed between 263 s and 412 s? cCalculate the mans speed for each lap. Is he slowing down, speeding up or neither? Time s Distance m 32 200 68 400 108 600 152 800 203 1000 263 1200 335 1400 412 1600arrow_forwardHeart Disease In a certain country, the number of deaths due to heart disease decreased from 235 in one year to 221 in the next year. What percentage decrease in deaths due to heart disease does this represent?arrow_forward

 Algebra & Trigonometry with Analytic GeometryAlgebraISBN:9781133382119Author:SwokowskiPublisher:Cengage
 College AlgebraAlgebraISBN:9781305115545Author:James Stewart, Lothar Redlin, Saleem WatsonPublisher:Cengage Learning
 Algebra and Trigonometry (MindTap Course List)AlgebraISBN:9781305071742Author:James Stewart, Lothar Redlin, Saleem WatsonPublisher:Cengage Learning
 Intermediate AlgebraAlgebraISBN:9781285195728Author:Jerome E. Kaufmann, Karen L. SchwittersPublisher:Cengage Learning