
Videos
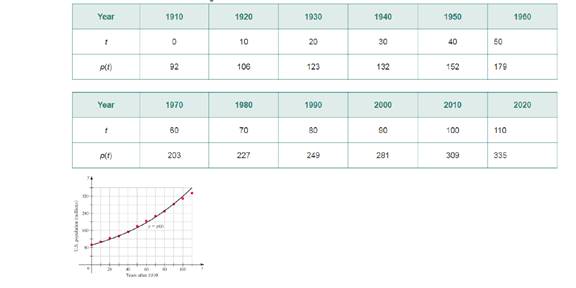
Population of the United States The population of the United States (in millions) by decade is given in the table, where t is the number of years alter 1910. These data are plotted and fitted with a smooth curve
- a. Compute the average rate of population growth from 1950 to 1960.
- b. Explain why the average rate of growth from 1950 to 1960 is a good approximation to the (instantaneous) rate of growth in 1955.
- c. Estimate the instantaneous rate of growth in 1985.

Trending nowThis is a popular solution!

Chapter 3 Solutions
Calculus, Early Transcendentals, Single Variable Loose-Leaf Edition Plus MyLab Math with Pearson eText - 18-Week Access Card Package
Additional Math Textbook Solutions
Thomas' Calculus: Early Transcendentals (14th Edition)
Calculus & Its Applications (14th Edition)
University Calculus: Early Transcendentals (4th Edition)
Calculus and Its Applications (11th Edition)
Precalculus (10th Edition)
University Calculus: Early Transcendentals (3rd Edition)


- Immigration The following graph shows immigrationin thousand to the United States has varied over the past century. Source: Homeland Security. a. Find the average annual rate of change in immigration for the first half of the century from 1905 to 1955. b. Find the average annual rate of change in immigration for the second half of the century from 1955 to 2005. c. Find the average annual rate of change in immigration for the entire century from 1905 to 2005. d. Average your answers to part a and b, and compare the result with your answer from part c. Will these always be equal for any two time periods? e. If the annual average rate of change for entire century continues, predict the number of immigrants in 2009. Compare answer to the actual number of 1,130,818 immigrants.arrow_forwardPopulation Growth and Decline The table gives the population in a small coastal community for the period 1997-2006. Figures shown arc for January 1 in each year. (a) What was the average rate of change of population between 1998 and 2001? (b) What was the average rate of change of population between 2002 and 2004? (C) For what period of lime was the population increasing? (d) For what period of time was the population decreasing?arrow_forwardTable 4 gives the population of a town (in thousand) from 2000 to 2008. What was the average rate of change of population (a) between 2002 and 2004, and (b) between 2002 and 2006?arrow_forward
- Temperature The graph shows the temperature T in degrees Celsius as a function of the altitude h in feet when an inversion layer is over Southern California. An inversion layer is formed when air at a higher altitude, say 300 ft, is warmer than the air at sea level, even though air normally is cooler with increasing altitude. Estimate and interpret the average rate of change in temperature for the following changes in altitude. a. 1000to3000ft b. 1000to5000ft c. 3000to9000ft d. 1000to9000ft e. At what altitude at or below 7000ft is the temperature highest ? Lowest ? How would your answer change if 7000ft is changed to 10,000ft? f. At what altitude is the temperature the same as it is at 1000ft?arrow_forwardTable 3 gives the annual sales (in millions of dollars) of a product from 1998 to 20006. What was the average rate of change of annual sales (a) between 2001 and 2002, and (b) between 2001 and 2004?arrow_forwardPhysician Demand The demand for physicians is expected to increase in the future, as shown in the accompanying table. Source: Association of American Medical Colleges. Year Demand for Physicians in thousands 2006 680.5 2015 758.6 2020 805.8 2025 859.3 a. Plot the data, letting t=0 correspond to 2000. Does fitting an exponential curve to the data seem reasonable? b. Use the data for 2006 and 2015, to find the function of the form f(t)=Cekt that goes through these two points. c. Use your function from part b to predict the demand for physicians in 2020 and 2025. How well do these predictions fit the data? d. If you have graphing calculator or computer program with an exponential regression feature, use it to find an exponential function that approximately fits the data. How does this answer compare with answer to part b?arrow_forward
- aThe average rate of change of a function f between x=a and x=b is the slope of the ___________ line between (a,f(a)) and (b,f(b)).arrow_forwardBody Mass Index The following graph shows how the body mass index-for-age percentile for girls varies from the age of 2to20 years. Source: Centers for Disease Control. a. Sketch a graph of the rate of change of the 95th percentile as a function of age. b. Sketch a graph of the rate of change of the 50th percentile as a function of age.arrow_forwardThe half-life of plutonium-244 is 80,000,000 years. Find function gives the amount of carbon-14 remaining as a function of time, measured in years.arrow_forward
- The American Food Dollar The following table shows the percentage P=P(d) of the American food dollar that was spent on eating away from home at restaurants, for example as function of the date d. d=Year P=Precentspentawayfromhome 1969 25 1989 30 2009 34 a. Find P(1989) and explain what it means. b. What does P(1999) mean? Estimate its value. c. What is the average rate of change per year in percentage of the food dollar spent away from home for the period from 1989 to 2009? d. What does P(2004) mean? Estimate its value. Hint: Your calculation in part c should be useful. e. Predict the value of P(2014) and explain how you made your estimate.arrow_forwardThe US. import of wine (in hectoliters) for several years is given in Table 5. Determine whether the trend appearslinear. Ifso, and assuming the trend continues, in what year will imports exceed 12,000 hectoliters?arrow_forwardMolars The crown length as shown below of first molars in fetuses is related to the postconception age of tooth as L(t)=0.01t2+0.788t7.048, Where L(t) is the crown length, in millimeters, of the molar t weeks after conception. Source: American Journal of Physical Anthropology. a. Find the average rate of growth in crown length during weeks 22 through 28. b. Find the instantaneous rate of growth in crown length when the tooth is exactly 22 weeks of age. c. Graph the function on [0,50] by [0,9]. Does a function that increases and then begins to decrease make sense for this particular application? What do you suppose is happening during the first 11 weeks? Does this function accurately model crown length during those weeks?arrow_forward
 College AlgebraAlgebraISBN:9781305115545Author:James Stewart, Lothar Redlin, Saleem WatsonPublisher:Cengage Learning
 Algebra and Trigonometry (MindTap Course List)AlgebraISBN:9781305071742Author:James Stewart, Lothar Redlin, Saleem WatsonPublisher:Cengage Learning
 Calculus For The Life SciencesCalculusISBN:9780321964038Author:GREENWELL, Raymond N., RITCHEY, Nathan P., Lial, Margaret L.Publisher:Pearson Addison Wesley,
 College Algebra (MindTap Course List)AlgebraISBN:9781305652231Author:R. David Gustafson, Jeff HughesPublisher:Cengage Learning
 Functions and Change: A Modeling Approach to Coll...AlgebraISBN:9781337111348Author:Bruce Crauder, Benny Evans, Alan NoellPublisher:Cengage Learning