
Videos
To describe: The transformation of graph of function
Answer to Problem 35E
The graph of the value gets increases and decreases simultaneously.
Explanation of Solution
Given information:
The given function as shown below,
Formula used:
The vertical axis represent the y axis and the horizontal axis represent x axis.
Calculation:
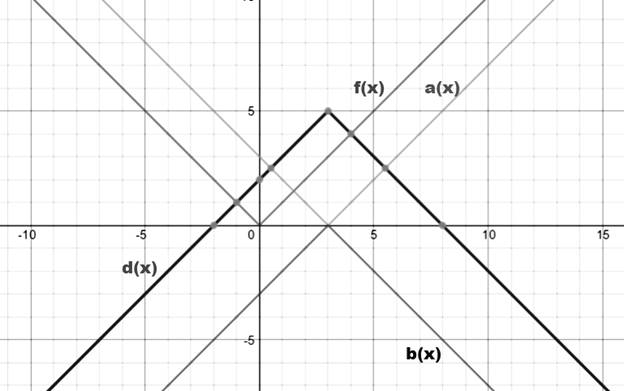
On translating the graph of f horizontally 3 unit right to get the graph of
Hence, on reflecting the graph of a into the x-axis to get the graph of
On translating the graph of b vertically 5 units up to get the graph of
The graph function as shown below,
Conclusion:
The graph of the value gets increases and decreases simultaneously.
Chapter 3 Solutions
BIG IDEAS MATH Algebra 1: Common Core Student Edition 2015


 Algebra and Trigonometry (6th Edition)AlgebraISBN:9780134463216Author:Robert F. BlitzerPublisher:PEARSON
 Contemporary Abstract AlgebraAlgebraISBN:9781305657960Author:Joseph GallianPublisher:Cengage Learning
 Linear Algebra: A Modern IntroductionAlgebraISBN:9781285463247Author:David PoolePublisher:Cengage Learning
 Algebra And Trigonometry (11th Edition)AlgebraISBN:9780135163078Author:Michael SullivanPublisher:PEARSON
 Introduction to Linear Algebra, Fifth EditionAlgebraISBN:9780980232776Author:Gilbert StrangPublisher:Wellesley-Cambridge Press
 College Algebra (Collegiate Math)AlgebraISBN:9780077836344Author:Julie Miller, Donna GerkenPublisher:McGraw-Hill Education