
Concept explainers
Videos
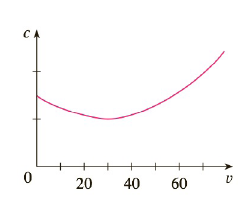
The graph shows the fuel consumption c of a car (measured in gallons per hour) as a function of the speed v of the car. At very low speeds the engine runs inefficiently, so initially c decreases as the speed increases. But at high speeds the fuel consumption increases. You can see that c(v) is minimized for this car when

Trending nowThis is a popular solution!

Chapter 3 Solutions
Bundle: Calculus, Loose-Leaf Version, 8th + WebAssign Printed Access Card for Stewart's Calculus, 8th Edition, Multi-Term


 College AlgebraAlgebraISBN:9781305115545Author:James Stewart, Lothar Redlin, Saleem WatsonPublisher:Cengage Learning
 Algebra and Trigonometry (MindTap Course List)AlgebraISBN:9781305071742Author:James Stewart, Lothar Redlin, Saleem WatsonPublisher:Cengage Learning
 Algebra & Trigonometry with Analytic GeometryAlgebraISBN:9781133382119Author:SwokowskiPublisher:Cengage