
Concept explainers
Videos
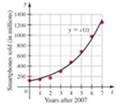
Smartphones From 2007 to 2014, there was a dramatic increase in smartphone sales The number of smartphones (in millions) sold to end users from 2007 to 2014 (see figure) is modeled by the function c(t) = 114.9e0.345t, where t represents the number of years after 2007.
a. Determine the average growth rate in smartphone sales between the years 2007 and 2009 and between 2012 and 2014. During which of these two time intervals was the growth rate greater?
b. Find the Instantaneous growth rate in smartphone sales at t = 1 (2008) and t = 6 (2013)? At which of these times was the instantaneous growth rate greater’
c. Use a graphing utility to graph the growth rate, for 0 ≤ t ≤ 7. What does the graph tell you about growth of smartphone sales to end users from 2007 to 2014?
Want to see the full answer?
Check out a sample textbook solution
Chapter 3 Solutions
CALCULUS:EARLY TRANSCENDENTALS-PACKAGE
Additional Math Textbook Solutions
University Calculus: Early Transcendentals (3rd Edition)
Calculus & Its Applications (14th Edition)
Precalculus (10th Edition)
Glencoe Math Accelerated, Student Edition
Thomas' Calculus: Early Transcendentals (14th Edition)


- The half-life of plutonium-244 is 80,000,000 years. Find function gives the amount of carbon-14 remaining as a function of time, measured in years.arrow_forwardEnter the data from Table 2 into a graphing calculator and graph the ranking scatter plot. Determine whetherthe data from the table would likely represent a function that is linear, exponential, or logarithmic.arrow_forwardMaria, a biologist is observing the growth pattern of a virus. She starts with 100 of the virus that grows at a rate of 10% per hour. She will check on the virus in 24 hours. How many viruses will she find?arrow_forward
- The US. import of wine (in hectoliters) for several years is given in Table 5. Determine whether the trend appearslinear. Ifso, and assuming the trend continues, in what year will imports exceed 12,000 hectoliters?arrow_forwardExponential Growth Is the graph of exponential growth versus time increasing or decreasing?arrow_forwardCancer Insulation workers who were exposed to asbestos and employed before 1960 experienced an increased likelihood of lung cancer. If a group of insulation workers has a cumulative total of 100,000 years of work experience with their first date of employment t years ago, then the number of lung cancer causes occuring within the group can be modeled using the function Nt=0.00437t3.2. Find the rate of growth of the number of workers with lung cancer in a group as described by the following first dates of employment. Source: Observation and Inference: An Introduction to the Methods of Epidemiology. a. 5 years ago b. 10 years agoarrow_forward
 Glencoe Algebra 1, Student Edition, 9780079039897...AlgebraISBN:9780079039897Author:CarterPublisher:McGraw Hill
 Calculus For The Life SciencesCalculusISBN:9780321964038Author:GREENWELL, Raymond N., RITCHEY, Nathan P., Lial, Margaret L.Publisher:Pearson Addison Wesley,

 Big Ideas Math A Bridge To Success Algebra 1: Stu...AlgebraISBN:9781680331141Author:HOUGHTON MIFFLIN HARCOURTPublisher:Houghton Mifflin Harcourt
 Algebra & Trigonometry with Analytic GeometryAlgebraISBN:9781133382119Author:SwokowskiPublisher:Cengage