Videos
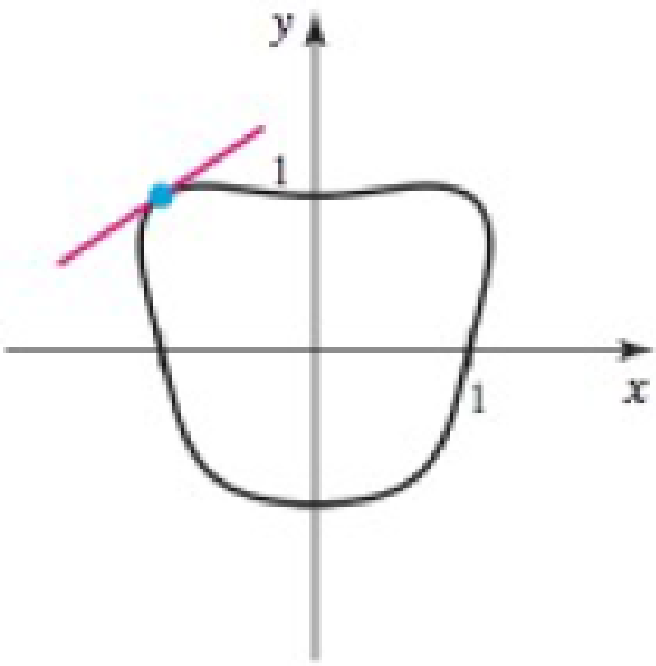
Normal lines A normal line at a point P on a curve passes through P and is perpendicular to the line tangent to the curve at P (see figure). Use the following equations and graphs to determine an equation of the normal line at the given point. Illustrate your work by graphing the curve with the normal line.
66. Exercise 26
26. x4 − x2y + y4 = 1; (−1, 1)
Want to see the full answer?
Check out a sample textbook solution
Chapter 3 Solutions
MyLab Math with Pearson eText -- Standalone Access Card -- for Calculus: Early Transcendentals (3rd Edition)
Additional Math Textbook Solutions
Glencoe Math Accelerated, Student Edition
Precalculus: Concepts Through Functions, A Unit Circle Approach to Trigonometry (4th Edition)
University Calculus: Early Transcendentals (4th Edition)
Calculus and Its Applications (11th Edition)
Calculus, Single Variable: Early Transcendentals (3rd Edition)


- When Date Are Unevenly speed. If data are evenly spaced, we need only calculate differences to see whether the data are linear. But if data not evenly spaced, then we must calculate the average rate of change over each interval to see whether the data are linear. If the average rate of changes is constant, it is the slope of the linear function. This fact is used in Exercises 23 and 24. In the following table, show that the average rate of change is the same over each interval. This shows the data are linear, even though the differences in y are not constant. Then find a linear model for the data. x 1 2 5 6 y 7 10 19 22arrow_forwardWhen Date Are Unevenly speed. If data are evenly spaced, we need only calculate differences to see whether the data are linear. But if data are not evenly spaced, then we must calculate the average rate of change over each interval to see whether the data are linear. If the average rate of change is constant, it is the slope of the linear function. This fact is used in Exercises 23 and 24. In the following table, show that the average rate of change from 2 to 5 is not the same as the average rate of change from 5 to 6. This shows that the data are not linear, even though the differences in y are constant. x 1 2 5 6 y 3 6 9 12arrow_forwardThe accompanying data show the number of bacteria present after a certain number of hours. Find the equation of the regression line for the data. Then construct a scatter plot of (x,y).arrow_forward
- Using the regressions line attached. The correct interpretation of the intercept in the plot is: a) as height increases, weight will decrease by 143 b) as height increases, weight will definitively increase by 3.899 c) as height increases by a single unit, height will increase by 143 units d) when height is equal to 0, the value of the intercept is equal to 0 e) when height is equal to 0, the value of the intercept is equal to approximately 70 f) when height is equal to 0, the predicted value for weight is equal to -143arrow_forwardThe average speed reached by the winners of the Tour de France increased by 53.9% since the first race in 1903 through 2017. We performed a regression of the average winning speeds on years, for the modern era of the Tour, from 1967 to 2017. We obtained the following scatterplot, showing the fitted line: ̂ Average Speed = −225.48 + 0.1323 Y ear. i) Are the conditions for regression met? ii) The years 1999–2005 have been disqualified because of doping. How does this help explain the fact that 9 out of 10 residuals in the final 10 years are negative? iii) Would you extrapolate from this model to predict next year’s winning speed?arrow_forwardTest for a significance of the positive slope. Use =0.05. State your decision and conclusion. a. Fail to reject Ho. No evidence for a positive slope. b. Fail to reject Ho. There is evidence for a positive slope. c. Reject Ho. No evidence for a positive slope. d. Reject Ho. There is evidence for a positive slope.arrow_forward
- 44. The slope coefficient estimate b from a regression of profits on sales of a number of firms in the coal industry is 0.075. How should you interpret this coefficient?a) Average profit in the coal industry is 7.5%.b) If a firm in the coal industry were to increase its sales by $1, its profits would rise on average by $0.075.c) If a firm has 1 more dollar in sales than another firm in the coal industry, it will have 7.5 more cents in profit on average.d) Average profit in the coal industry is .75%.e) If a firm in the coal industry were to increase its sales by $1, its profits would rise on average by $0.0075.45. A regression’s equation is given as: Q = 5 – 3P, which means that:a) a 3% increase in Price will decrease Quantity by 1%b) a 1% increase in Price will increase Quantity by 3%c) a 1% increase in Price will decrease Quantity by 3%d) a 3% increase in Quantity will decrease Price by 1%arrow_forwardWrite the regression equation for the standard curve here. 1. First, rearrange the regression equation to solve for x. Y= 0.1074 X -0.1223 2. From the three unknown tube results, plug the average y value into the equation and calculate the x value. This should tell you how many grams of BSA were present in that assay tube on average. (Hint: think about how many significant figures are needed). 3. You will need to factor in the volume of the unknown sample that was placed in the reaction tube in order to obtain a concentration of BSA in the original unknown sample before dilution. three unknown tube results. 0.267 0.280 0.280arrow_forwardThe accompanying data show the number of bacteria present after a certain number of hours. Find the equation of the regression line for the data. Then construct a scatter plot of (x,y) and sketch the regression line with it. Number of hours, x Number of bacteria, y1 1652 2803 4694 7775 13106 19207 4907arrow_forward
- In a regression analysis situation, the standard error of the slope is a. a measure of the variation in the estimated regression line from sample to sample b. a measure of the amount of change in x that will occur for a one unit change in y c. equal to the square root of the standard error of the estimate d. a measure of the amount of change in y that will occur for a one unit change in x e. None of the suggested answers are correctarrow_forwardMore misinterpretations A Sociology student investi-gated the association between a country’s Literacy Rate and Life Expectancy, then drew the conclusions listedbelow. Explain why each statement is incorrect. (Assumethat all the calculations were done properly.) a) The Literacy Rate determines 64% of the Life Expec-tancy for a country. b) The slope of the line shows that an increase of 5% inLiteracy Rate will produce a 2-year improvement inLife Expectancy.arrow_forward7) The accompanying data show the number of bacteria present after a certain number of hours. Find the equation of the regression line for the data. Then construct a scatter plot of (x,y) and sketch the regression line with i Number of hours, x Number of bacteria, y1 1672 2783 4684 7835 13146 19277 4910 The equation of the regression line is y=x+ (Round to two decimal places as needed.) Construct a scatter plot of the data and draw the regression line. Choose the correct graph below.arrow_forward
 Trigonometry (MindTap Course List)TrigonometryISBN:9781337278461Author:Ron LarsonPublisher:Cengage Learning
 Functions and Change: A Modeling Approach to Coll...AlgebraISBN:9781337111348Author:Bruce Crauder, Benny Evans, Alan NoellPublisher:Cengage Learning
 Algebra & Trigonometry with Analytic GeometryAlgebraISBN:9781133382119Author:SwokowskiPublisher:Cengage
 Big Ideas Math A Bridge To Success Algebra 1: Stu...AlgebraISBN:9781680331141Author:HOUGHTON MIFFLIN HARCOURTPublisher:Houghton Mifflin Harcourt
 Algebra and Trigonometry (MindTap Course List)AlgebraISBN:9781305071742Author:James Stewart, Lothar Redlin, Saleem WatsonPublisher:Cengage Learning