Videos
Logistic growth Scientists often use the logistic growth function
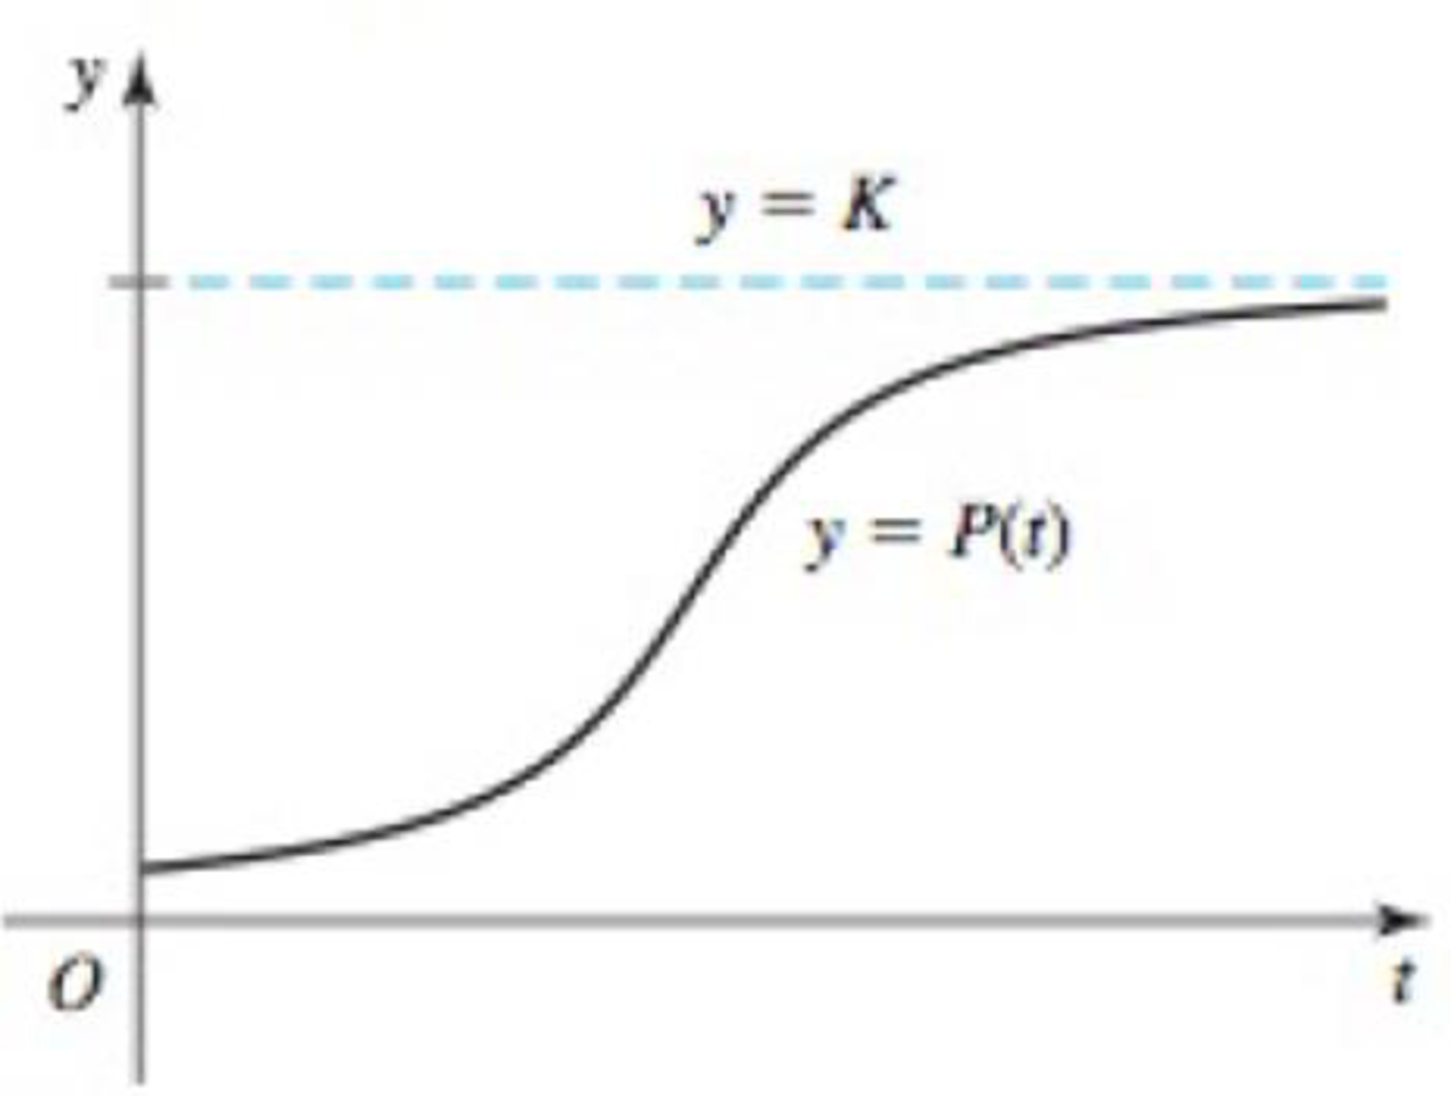
93. Gone fishing When a reservoir is created by a new dam, 50 fish are introduced into the reservoir, which has an estimated carrying capacity of 8000 fish. A logistic model of the fish population is
- a. Graph P using a graphing utility. Experiment with different windows until you produce an S-shaped curve characteristic of the logistic model. What window works well for this function?
- b. How long does it take the population to reach 5000 fish? How long does it take the population to reach 90% of the carrying capacity?
- c. How fast (in fish per year) is the population growing at t = 0? At t = 5?
- d. Graph P’ and use the graph to estimate the year in which the population is growing fastest.
Want to see the full answer?
Check out a sample textbook solution
Chapter 3 Solutions
Calculus: Early Transcendentals, 2nd Edition
Additional Math Textbook Solutions
Glencoe Math Accelerated, Student Edition
University Calculus: Early Transcendentals (3rd Edition)
Precalculus (10th Edition)
Precalculus
Precalculus Enhanced with Graphing Utilities (7th Edition)
University Calculus: Early Transcendentals (4th Edition)


- In the exponential growth or decay function y=y0ekt, what does y0 represent? What does k represent?arrow_forwardWhat is the carrying capacity for a population modeled by the logistic equation P(t)=250,0001+499e0.45t ? initial population for the model?arrow_forwardWhat is the y -intercept of the logistic growth model y=c1+aerx ? Show the steps for calculation. What does this point tell us about the population?arrow_forward
- Table 6 shows the population, in thousands, of harbor seals in the Wadden Sea over the years 1997 to 2012. a. Let x represent time in years starting with x=0 for the year 1997. Let y represent the number of seals in thousands. Use logistic regression to fit a model to these data. b. Use the model to predict the seal population for the year 2020. c. To the nearest whole number, what is the limiting value of this model?arrow_forwardThe table shows the mid-year populations (in millions) of five countries in 2015 and the projected populations (in millions) for the year 2025. (a) Find the exponential growth or decay model y=aebt or y=aebt for the population of each country by letting t=15 correspond to 2015. Use the model to predict the population of each country in 2035. (b) You can see that the populations of the United States and the United Kingdom are growing at different rates. What constant in the equation y=aebt gives the growth rate? Discuss the relationship between the different growth rates and the magnitude of the constant.arrow_forwardSuppose that a particular plot of land can sustain 500 deer and that the population of this particular species of deer can be modeled according to the logistic model as dPdt=0.2(1P500)P. Each year, a proportion of the herd deer is sold to petting zoos. a. Find the function that gives the equilibrium population for various proportions. b. Determine the maximum number of deer that should be sold to petting zoos each year. Hint: Find the maximum sustainable harvestarrow_forward
 Calculus For The Life SciencesCalculusISBN:9780321964038Author:GREENWELL, Raymond N., RITCHEY, Nathan P., Lial, Margaret L.Publisher:Pearson Addison Wesley,
 Algebra & Trigonometry with Analytic GeometryAlgebraISBN:9781133382119Author:SwokowskiPublisher:Cengage
 Glencoe Algebra 1, Student Edition, 9780079039897...AlgebraISBN:9780079039897Author:CarterPublisher:McGraw Hill